A combination of factors, including the supply/demand imbalance, OPEC+ production cuts, and the oil charts, suggest this is a golden time to buy oil and oil stocks. Regarding the oil price (NYSEARCA: USO), the oil price rose more than 7% in the week ended 9/1 to set a new 1-year high. The move broke the oil market out of a trading range and set it up to move higher.
The outlook is for oil prices to trend higher through the end of the year, at least putting it in the range of $95 to $100, and the technical signal is solid. This should drive revenue and earnings for the oil industry.
Not only did the market create a recognizable candle formation, but it did so while breaking critical resistance. The break out is confirmed by the indicators Stochastic and MACD, which show bullish crossovers. The signal is stronger because a Golden Cross was formed, which could lead the market for the next 12 to 24 months and drive another year of windfall profits for energy companies.
What is a Golden Cross? It is when the short-term EMA crosses over the long-term from below and indicates that short-term traders and long-term investors are aligned.
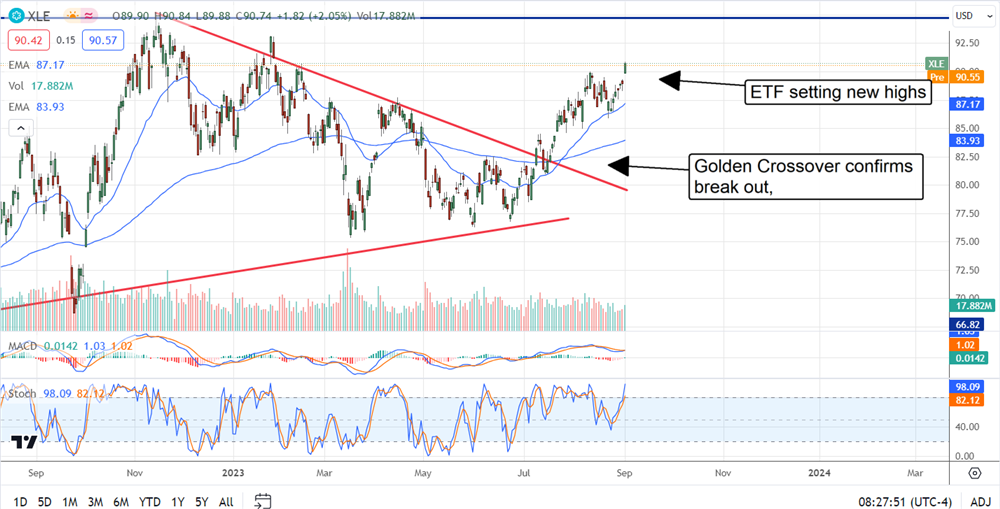
The oil stock market echoes the signal in oil. The S&P 500 Energy Select Sector tracking stock (NYSEARCA: XLE) also shows a Golden Cross. This Golden Cross confirmed a break out from a Bullish Triangle that should take the ETF to the top of its trading range. That move is worth about 5%, and the gains will be greater if the oil market follows through on its signal and continues higher.
Exxon Mobil, the World’s Leading Energy Company
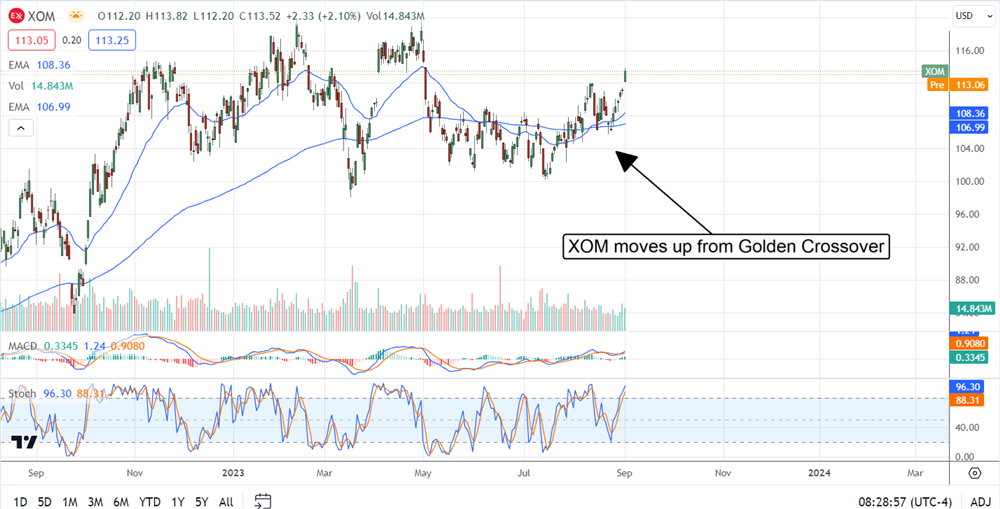
Exxon Mobil (NYSEARCA: XOM) is the world’s largest independently operated energy company outside OPEC and China. It is more than 21% of the XLE ETF and yields about 3.2% compared to the fund’s 3.5%. The stock provides value relative to the S&P 500 (NYSEARCA: SPY), trading at only 12X earnings, and there is a catalyst in the outlook.
The analysts have been lowering their targets for Q3 and Q4 even as oil prices have risen, which suggests the bar is set low and outperformance should be expected. The consensus figures for 2024 are even more promising and expect YOY declines in revenue and earnings to continue. Assuming oil prices continue to rise, Exxon’s results should return to growth, and it could happen by Q4 of this year.
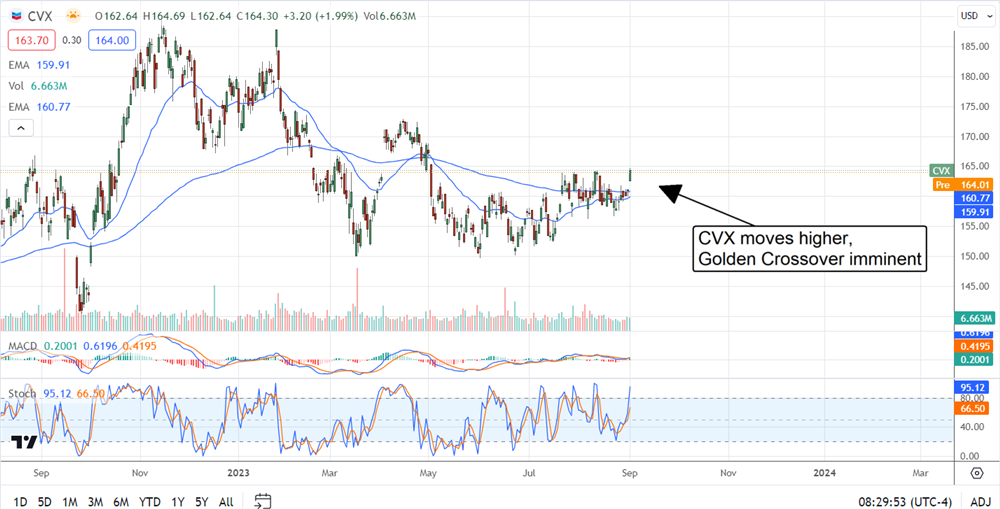
Chevron Could Outperform the Market In Q3 and Q4
Chevron Corporation (NYSE: CVX) is another integrated oil giant with high share prices on tap. The company stock is about 18% of the XLE ETF and yields 3.7%. That’s above the sector average and XOM’s payout, which commands a slightly higher 13.5X P/E multiple. However, this is still a bargain, considering the average S&P 500 company pays less and costs more.
The payout is reliably safe without the prospect of earnings growth, and this company is expected to grow top and bottom-line results next year. Recent increases are worth high-single-digits and are compounded by share repurchases.
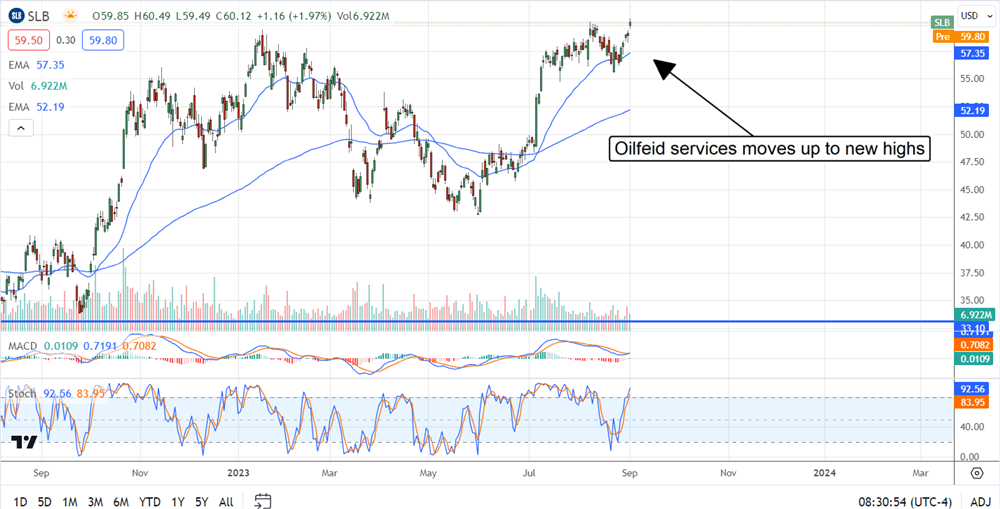
Schlumber, For Aggressive Dividend Growth
Schlumberger (NYSE: SLB) is leading the oil industry and riding an oil-field super-cycle to new heights. The stock trades at a higher valuation and yields much less at 20X and 1.65%, but there is an expectation for aggressive dividend growth. The company has yet to normalize the payout to its prepandemic levels, which is expected. The company has increased the payout twice and is on track to continue raising the distribution at a double-digit pace.
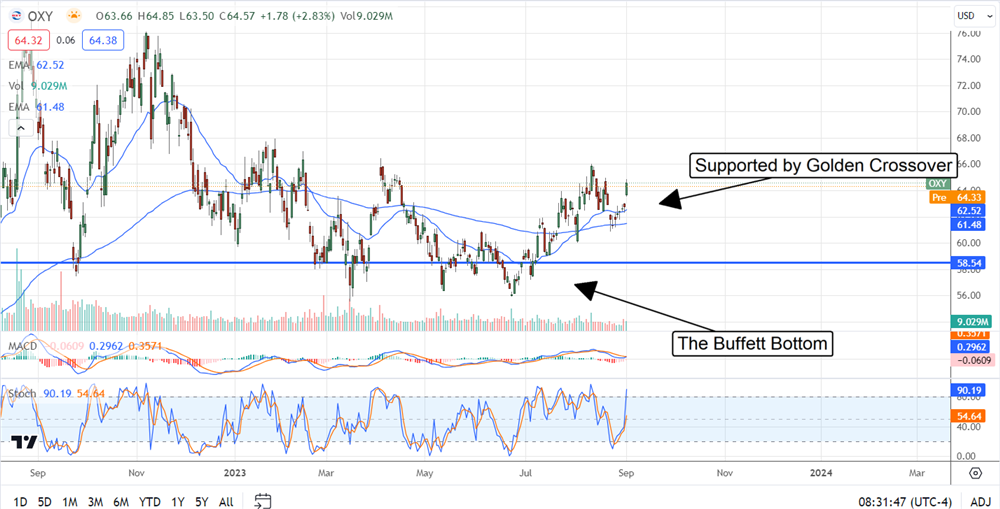
Be Like Buffett; Buy Occidental Petroleum
Buffett made a splash in the energy patch when he began to buy up Occidental Petroleum (NYSE: OXY) in 2022. That turned into a trend that has put a floor in OXY shares at $56. OXY is also on track for aggressive dividend growth and balance sheet improvement. The company is buying back preferred shares in 2023, among the catalysts that spurred Mr. Buffett and Berkshire Hathaway to buy.
Shares of OXY are moving higher following the last round of Berkshire purchases and show solid support above a Golden Cross.
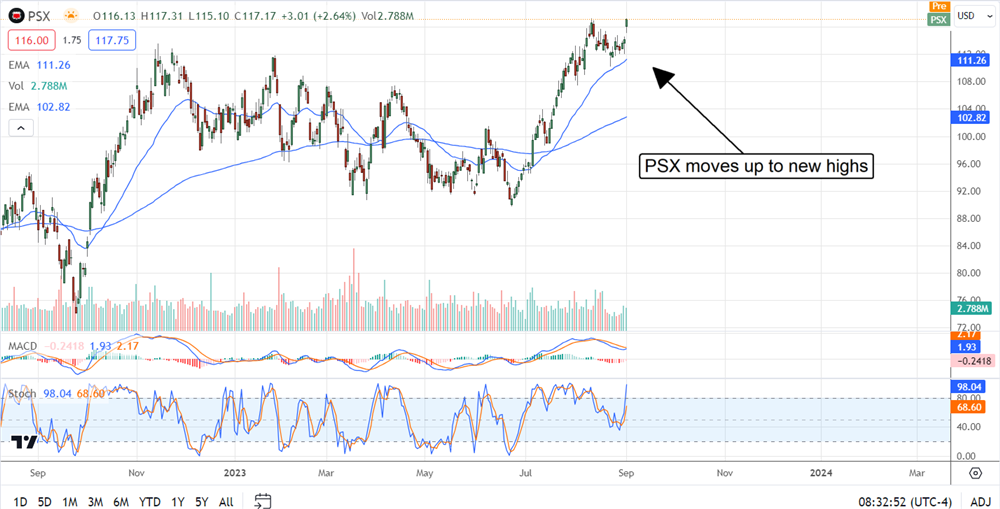
Phillips 66 for Midstream Exposure
Phillips 66 (NYSE: PSX) operates a network of refineries mid-stream and downstream assets that produce solid cash flow. The company pays a dividend worth 3.6%, with shares trading near a multi-year high, and the indications are bullish. Along with the dividend, the company repurchases shares, which effectively quadruples the yield. Results are expected to be mixed over the next few quarters and into next year, but earnings should be sufficient to sustain dividend increases and repurchases.