
Nasdaq, Inc. (NDAQ) reported strong free cash flow and FCF margins for Q4, but NDAQ stock has dropped 14% since then. One attractive play today is shorting out-of-the-money put options with a one-month expiry.
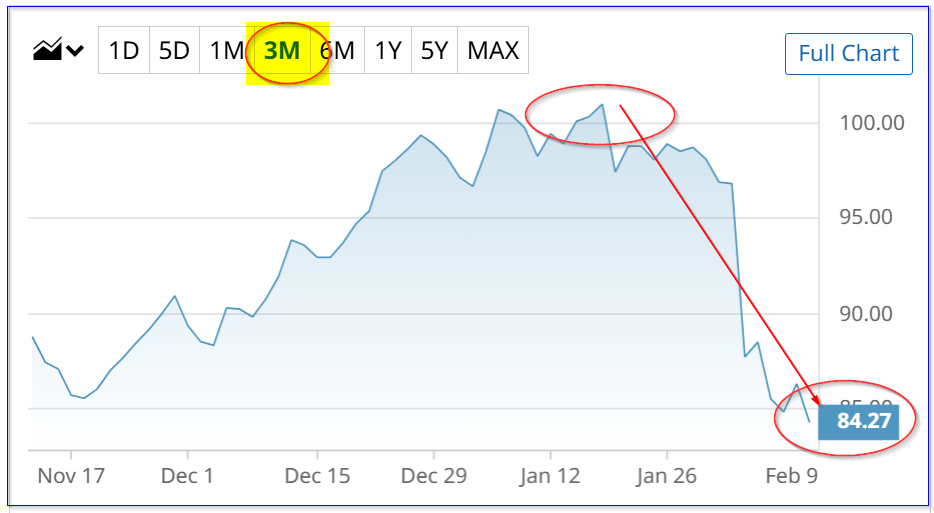
NDAQ is at $84.17, down from a recent peak of $100.98 on Jan. 16 and $98.09 on Jan. 29, just before its Jan. 30 release of Q4 and 2025 results.
Strong Free Cash Flow (FCF) and Forecasts
These results showed that revenue was up 13% in 2025 and annualized recurring revenue (ARR) rose 10% in Q4.
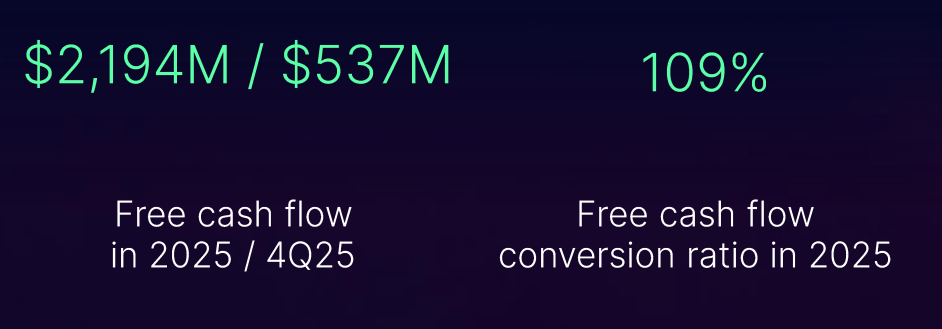
More importantly, its free cash flow (FCF) was almost $2.2 billion in 2025, as seen in its earnings deck presentation. That represents 42.3% of its 2025 net revenue of $5.2 billion, showing that Nasdaq is extremely cash-flow profitable.
For example, last year it made just $1.732 billion in FCF, representing 37.3% of its $4.649 billion in net revenue. So, with higher revenue, its margins are expanding. That means Nasdaq is squeezing out more cash with higher sales, an indication of very powerful operating leverage.
In Q4, its $537 million in FCF represented 38.6% of its $1.392 billion in net revenue. So, if we assume that in 2026 Nasdaq, Inc. will generate aproximately 40% of revenue in FCF, we can estimate its FCF.
For example, analysts now forecast net revenue in 2026 rise to $5.7 billion (i.e., +0.5 billion, or +9.6%) and in 2027 it will reach $6.17 billion (+18.65%).
So, assuming over the next 12 months (NTM) net revenue reaches $5.72 billion, i.e., up 10%, FCF could rise slightly:
$5.72b x 0.40 = $2.288 billion FCF
That is slightly higher than the $2.194 billion in FCF it generated in 2025 (i.e., +4.1%).
Here is what that means for a target price (TP) for NDAQ stock.
Target Prices for NDAQ
Let's assume that the market will value NDAQ stock with a 4.25% FCF yield. That is the same as multiplying FCF by 23.5 (i.e., 1/0.0425 = 23.53):
$2.288 b FCF x 23.53 = $53.84 billion market value
Today, Nasdaq, Inc. has a market cap of $48.17 billion, according to Yahoo! Finance. That means the stock could have a potential gain of 14.0% (i.e., $53.84b/$48.17b):
$84.17 stock price x 1.14 = $95.95 target price (TP)
That TP is actually lower than what other analysts say its TP should be. For example, Yahoo! Finance reports that the average TP of 17 analysts is $108.33.
Similarly, Barchart's mean survey TP is $111.81, and AnaChart.com, which tracks recent analysts' TPs, reports an average of $96.54 from 12 analysts. The average survey TP is $105.56, or +25% higher than today's price
The bottom line is that NDAQ stock looks to be 14% to 25% undervalued.
One way to play this is to sell short out-of-the-money (OTM) puts. That way, an investor can set a lower buy-in price, in case NDAQ keeps falling, and still get paid while waiting.
Shorting NDAQ Puts
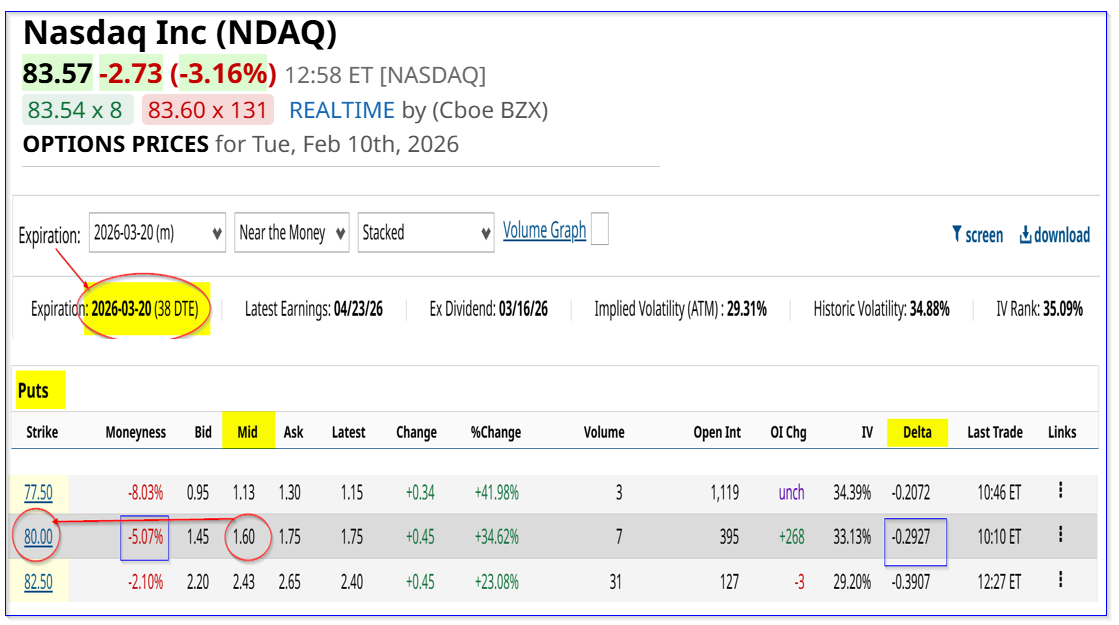
For example, the March 20, 2026 expiry period, 38 days to expiry (DTE), shows that the $80.00 strike price put option (5% lower than today) has a midpoint premium of $1.60.
That means a short-seller of this put contract can make an immediate 2.0% yield (i.e., $1.60/$80.00).
This means that the investor must first secure $8,000 in cash or buying power with their brokerage firm. Then, after entering an order to “Sell to Open” 1 put at $80.00, the account will receive $160.00. That is why the investment yields 2.0%.
As long as NDAQ stays over $80.00 before March 20 close, the account will not be assigned to buy 100 shares of NDAQ at $80.00 using the $8K in collateral.
But, even if that happens, the investor has a lower all-in cost:
$80.00 - $1.60 = $78.40 breakeven cost
That is over 6% lower than today's price. The point is that this is a great way to set a lower potential buy-in point and get paid a high yield while waiting to buy NDAQ stock.
On the date of publication, Mark R. Hake, CFA did not have (either directly or indirectly) positions in any of the securities mentioned in this article. All information and data in this article is solely for informational purposes. For more information please view the Barchart Disclosure Policy here.
More news from Barchart
- Airbnb’s (ABNB) Upcoming Earnings Present a ‘Binary’ Opportunity
- Nasdaq, Inc. Stock Is Off Its Highs, Despite Strong Results - Short Put Plays Work Here
- These Low IV Stocks May Be Setting Up for an Explosive Move
- Apple's FCF Margins Surge and Its Target Value Rises - What's the Best AAPL Stock Play?


