Toy and entertainment company Hasbro (NASDAQ: HAS) announced better-than-expected revenue in Q4 CY2025, with sales up 31.3% year on year to $1.45 billion. Its non-GAAP profit of $1.51 per share was 59.3% above analysts’ consensus estimates.
Is now the time to buy Hasbro? Find out by accessing our full research report, it’s free.
Hasbro (HAS) Q4 CY2025 Highlights:
- Revenue: $1.45 billion vs analyst estimates of $1.26 billion (31.3% year-on-year growth, 14.4% beat)
- Adjusted EPS: $1.51 vs analyst estimates of $0.95 (59.3% beat)
- Adjusted EBITDA: $372.2 million vs analyst estimates of $267.2 million (25.7% margin, 39.3% beat)
- EBITDA guidance for the upcoming financial year 2026 is $1.43 billion at the midpoint, above analyst estimates of $1.31 billion
- Operating Margin: 20.6%, up from 5.4% in the same quarter last year
- Free Cash Flow Margin: 24.4%, up from 18.9% in the same quarter last year
- Market Capitalization: $13.58 billion
“I am proud of the results our team delivered in 2025 and the success of our Playing to Win strategy,” said Chris Cocks, Chief Executive Officer of Hasbro.
Company Overview
Credited with the creation of toys such as Mr. Potato Head and the Rubik’s Cube, Hasbro (NASDAQ: HAS) is a global entertainment company offering a diverse range of toys, games, and multimedia experiences for children and families.
Revenue Growth
Reviewing a company’s long-term sales performance reveals insights into its quality. Any business can have short-term success, but a top-tier one grows for years. Hasbro’s demand was weak over the last five years as its sales fell at a 3% annual rate. This was below our standards and is a sign of poor business quality.
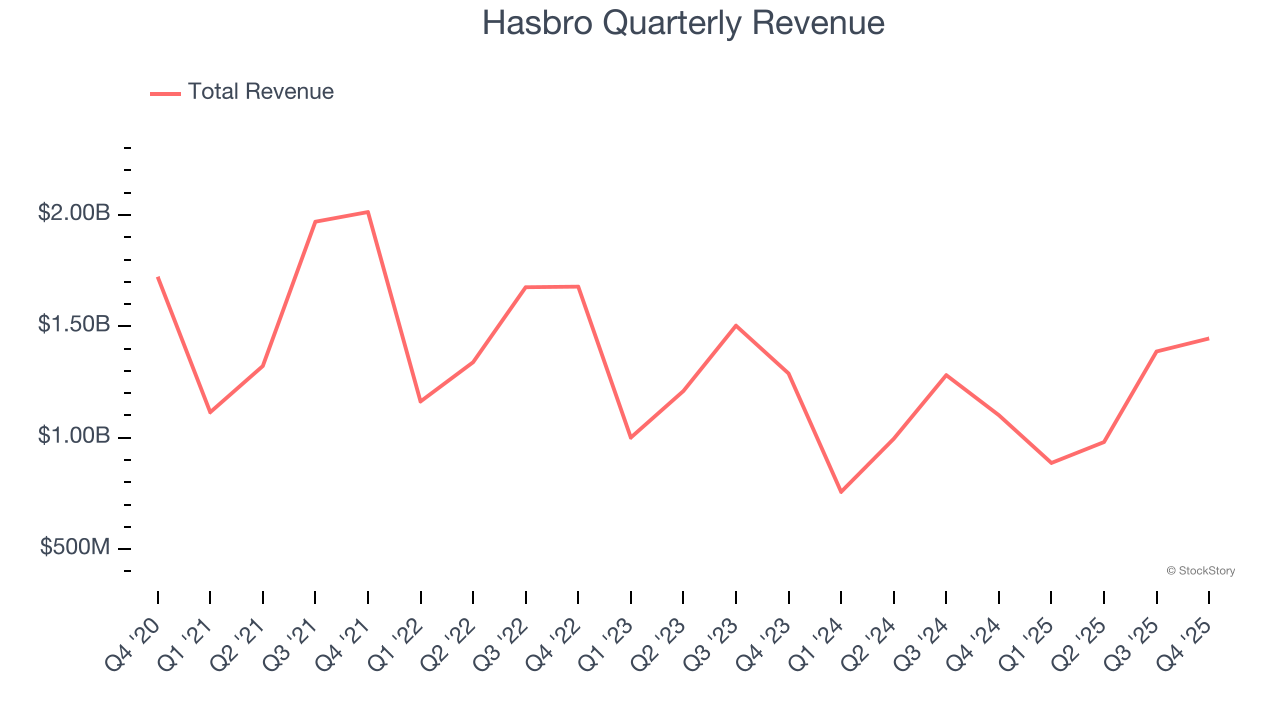
Long-term growth is the most important, but within consumer discretionary, product cycles are short and revenue can be hit-driven due to rapidly changing trends and consumer preferences. Hasbro’s annualized revenue declines of 3.1% over the last two years align with its five-year trend, suggesting its demand has consistently shrunk. 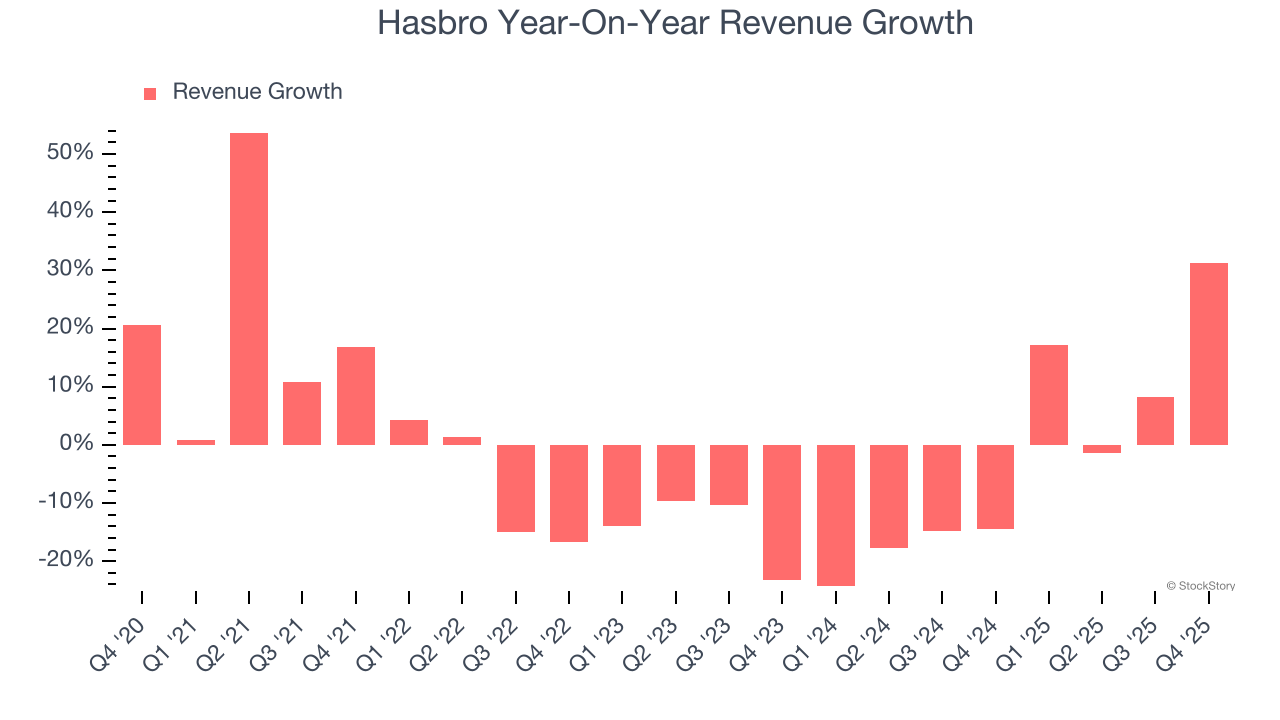
We can dig further into the company’s revenue dynamics by analyzing its three most important segments: Consumer Products, Entertainment, and Wizards & Digital Gaming, which are 43.6%, 55.3%, and 1.1% of revenue. Over the last two years, Hasbro’s Entertainment revenue (content) averaged 4,671% year-on-year growth while its Consumer Products (toys, games, apparel) and Wizards & Digital Gaming (Wizards of the Coast) revenues averaged 24.5% and 95.4% declines. 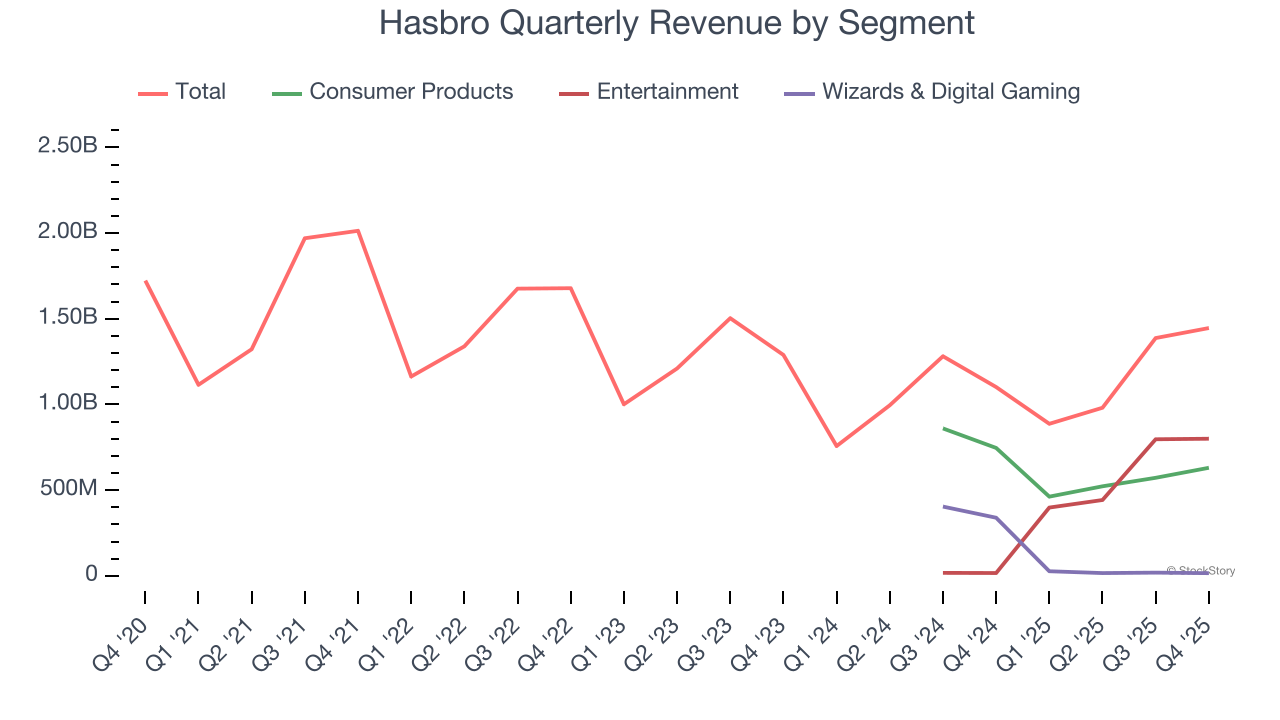
This quarter, Hasbro reported wonderful year-on-year revenue growth of 31.3%, and its $1.45 billion of revenue exceeded Wall Street’s estimates by 14.4%.
Looking ahead, sell-side analysts expect revenue to remain flat over the next 12 months. Although this projection implies its newer products and services will catalyze better top-line performance, it is still below the sector average.
Software is eating the world and there is virtually no industry left that has been untouched by it. That drives increasing demand for tools helping software developers do their jobs, whether it be monitoring critical cloud infrastructure, integrating audio and video functionality, or ensuring smooth content streaming. Click here to access a free report on our 3 favorite stocks to play this generational megatrend.
Operating Margin
Operating margin is an important measure of profitability as it shows the portion of revenue left after accounting for all core expenses – everything from the cost of goods sold to advertising and wages. It’s also useful for comparing profitability across companies with different levels of debt and tax rates because it excludes interest and taxes.
Hasbro’s operating margin has been trending down over the last 12 months and averaged 7.9% over the last two years. The company’s profitability was mediocre for a consumer discretionary business and shows it couldn’t pass its higher operating expenses onto its customers.
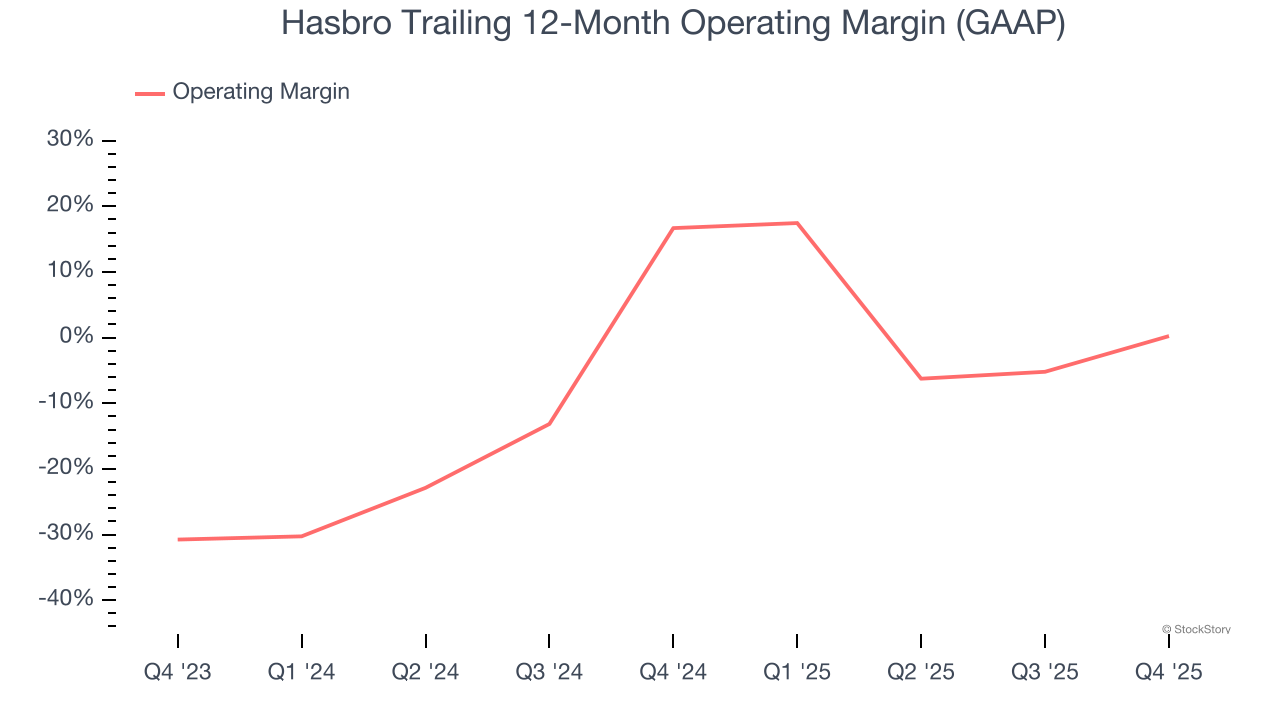
In Q4, Hasbro generated an operating margin profit margin of 20.6%, up 15.1 percentage points year on year. This increase was a welcome development and shows it was more efficient.
Earnings Per Share
We track the long-term change in earnings per share (EPS) for the same reason as long-term revenue growth. Compared to revenue, however, EPS highlights whether a company’s growth is profitable.
Hasbro’s EPS grew at a weak 8.1% compounded annual growth rate over the last five years. On the bright side, this performance was better than its 3% annualized revenue declines and tells us management adapted its cost structure in response to a challenging demand environment.
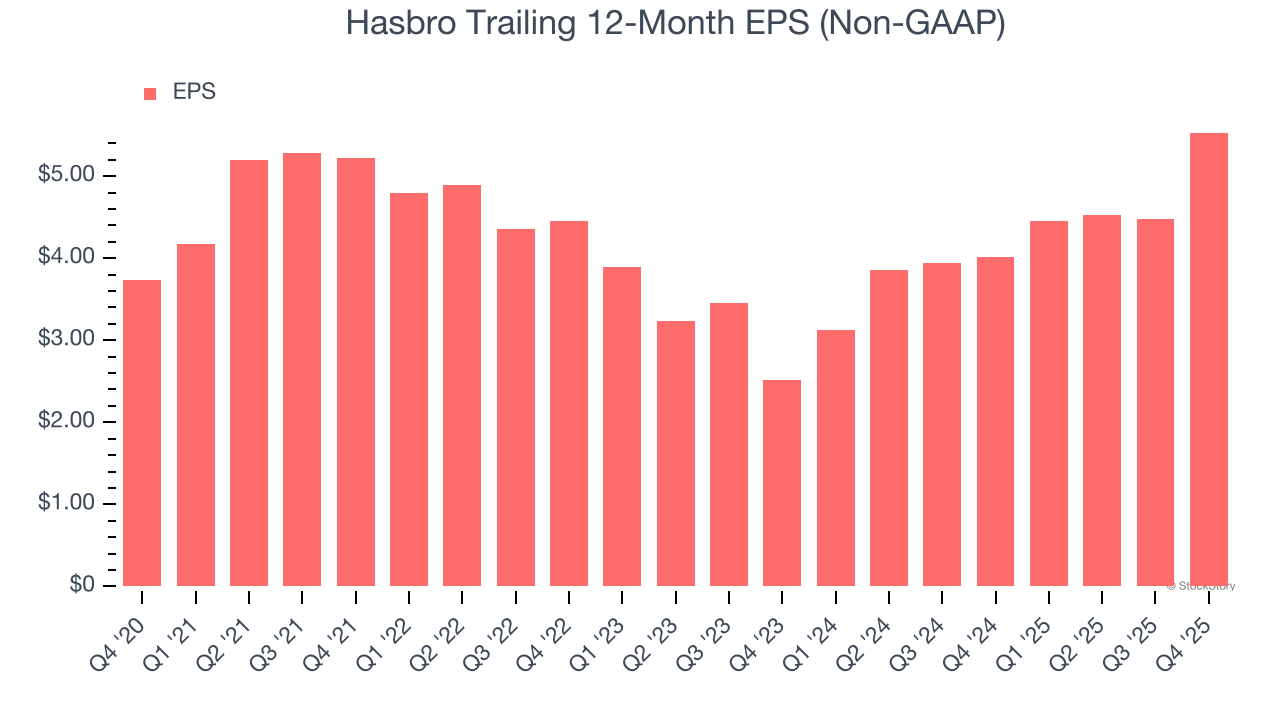
In Q4, Hasbro reported adjusted EPS of $1.51, up from $0.46 in the same quarter last year. This print easily cleared analysts’ estimates, and shareholders should be content with the results. Over the next 12 months, Wall Street expects Hasbro’s full-year EPS of $5.53 to shrink by 4.2%.
Key Takeaways from Hasbro’s Q4 Results
It was good to see Hasbro beat analysts’ EPS expectations this quarter. We were also excited its EBITDA outperformed Wall Street’s estimates by a wide margin. Zooming out, we think this was a good print with some key areas of upside. The stock remained flat at $97.35 immediately after reporting.
Hasbro had an encouraging quarter, but one earnings result doesn’t necessarily make the stock a buy. Let’s see if this is a good investment. If you’re making that decision, you should consider the bigger picture of valuation, business qualities, as well as the latest earnings. We cover that in our actionable full research report which you can read here (it’s free).