
Health insurance and services provider The Cigna Group (CI) continues to provide efficient healthcare outcomes for its customers through a focused execution across its diversified portfolio of businesses. By virtue of that, the company reported a solid 7% year-over-year growth in its adjusted revenues to $48.62 billion in the second quarter (ended June 30).
The company also raised its full-year (fiscal 2023) revenue projection by $2 billion to at least $190 billion, while its cash flow from operations forecast was increased by $500 million to at least $9.50 billion.
Moreover, in August, CI announced that it would remove the requirement for prior authorization of paperwork to get approval for insurance coverage for 25% of medical services to curb the hassle of restrictive procedures. This could bolster the company’s customer growth.
Furthermore, health insurance is becoming increasingly important globally with the increase in geriatric population, prevalence of chronic illnesses, and healthcare spending. The global health insurance market is expected to exhibit a revenue CAGR of 5.6% to reach $5.66 trillion in 2032.
Given this backdrop, let’s look at the trends of CI’s key financial metrics to understand why it could be wise to invest in the stock prior to its third-quarter earnings release on November 2.
Cigna's Financial Performance: Fluctuating Trends, Growth Rates, and Analysts' Predictions
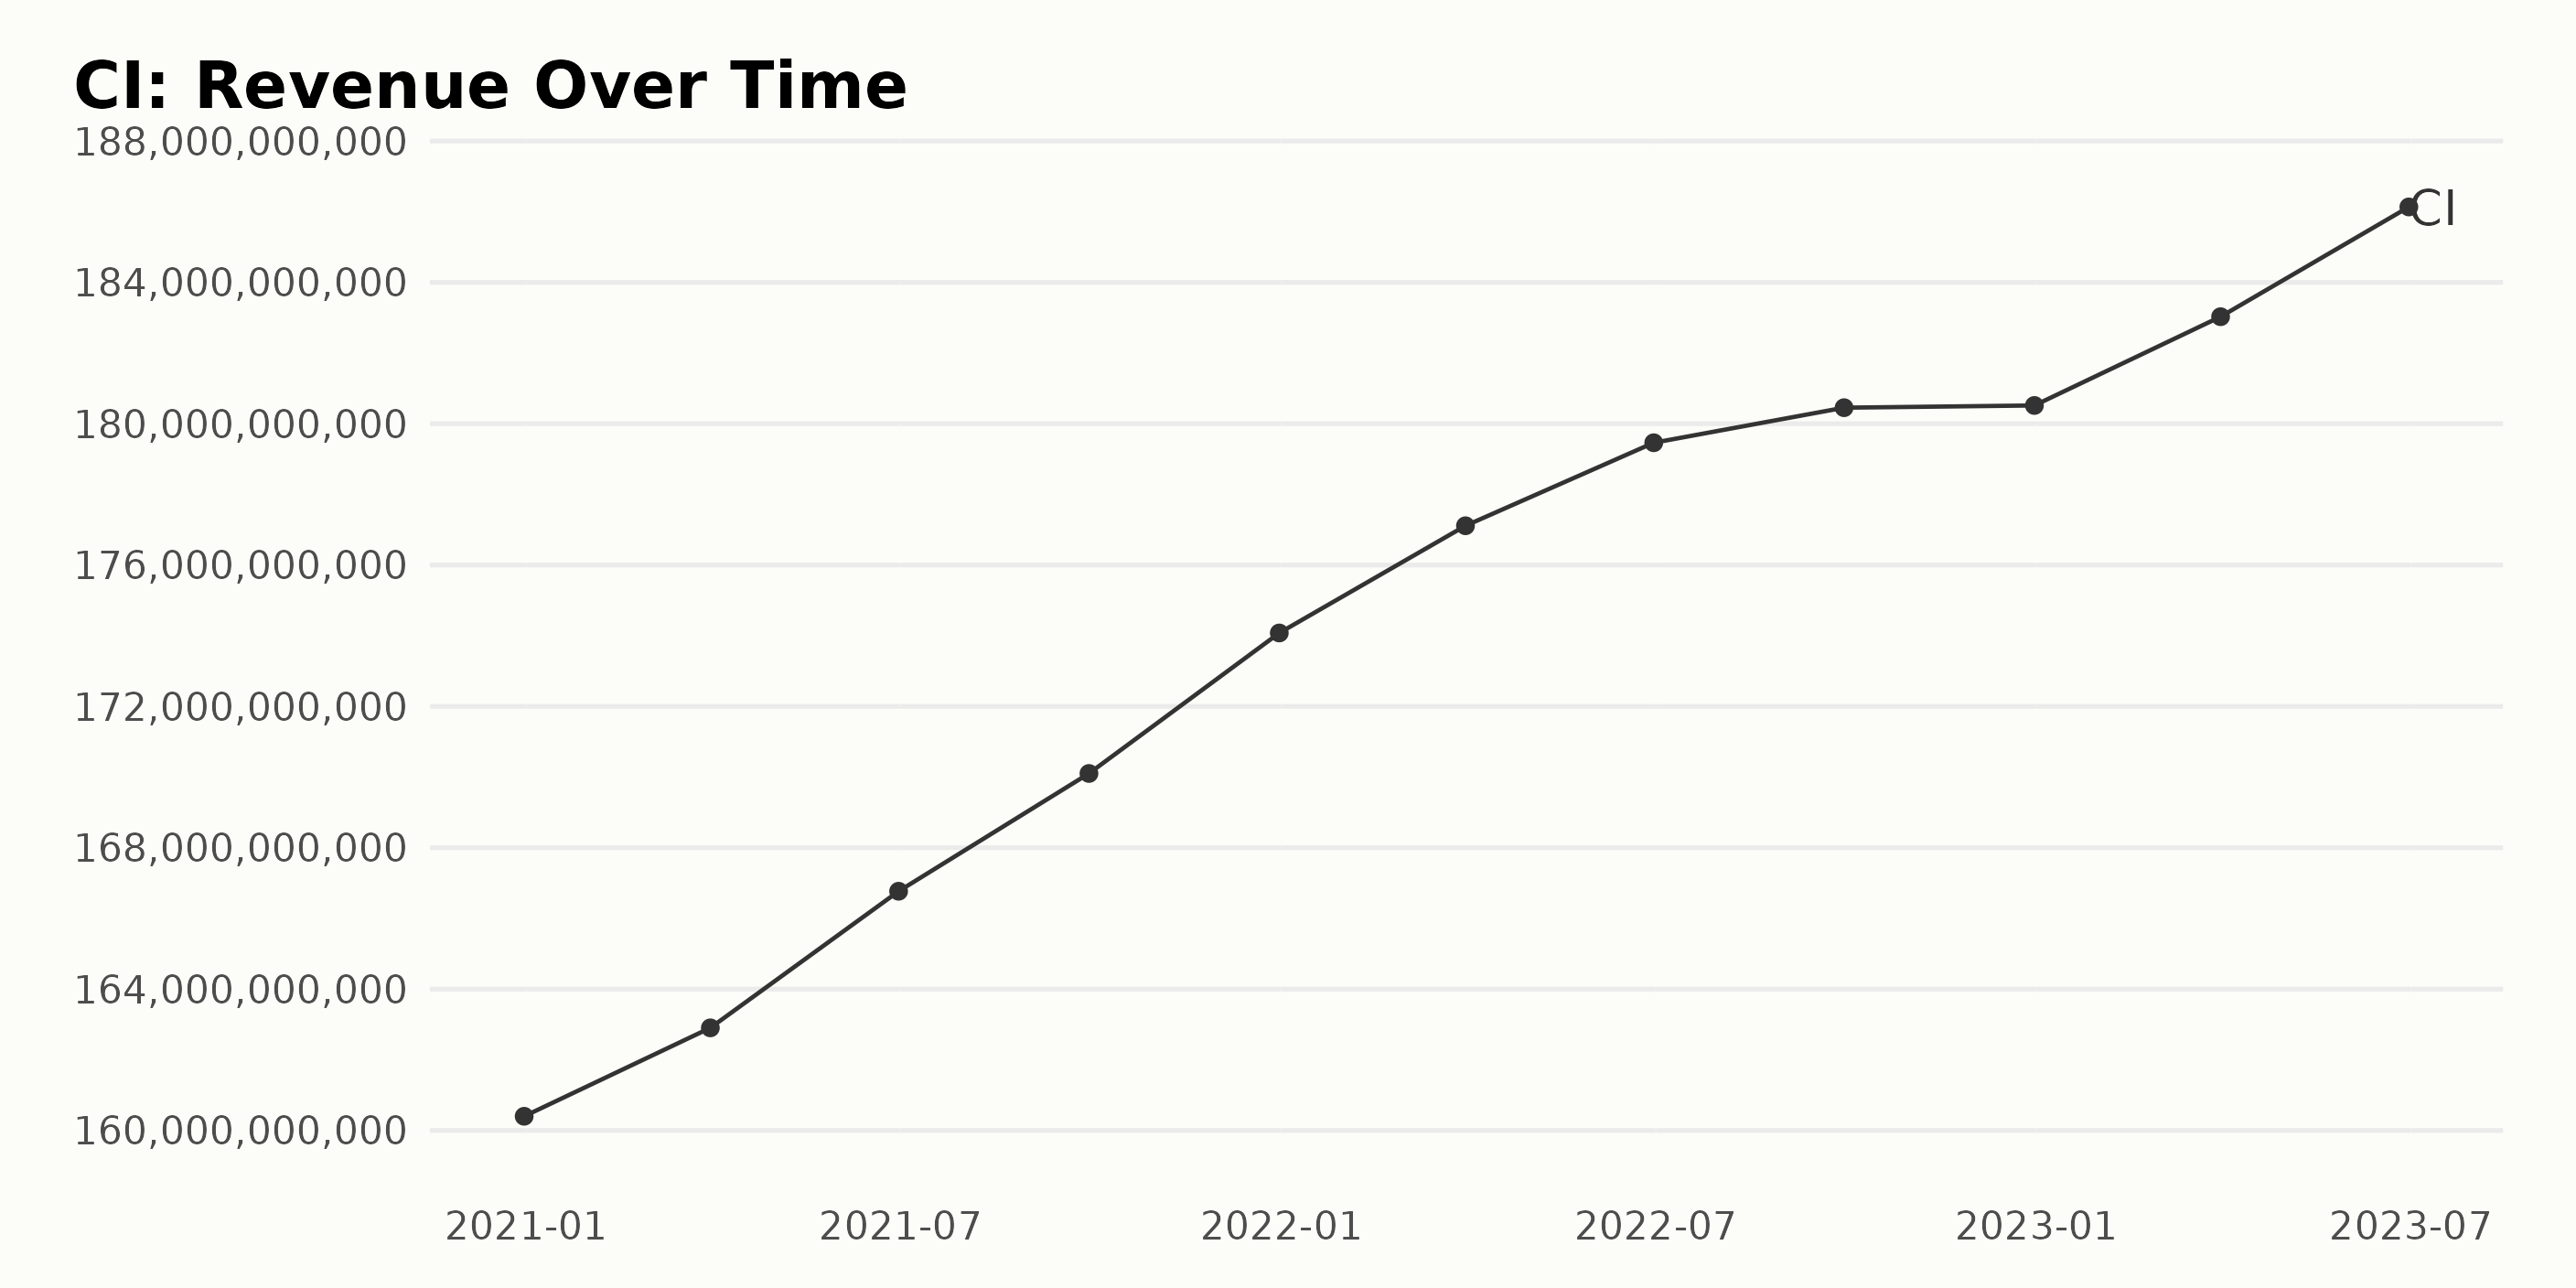
The series represents the trailing-12-month revenue of CI from December 31, 2020, to June 30, 2023.
- At the beginning of the time series, on December 31, 2020, the revenue stood at $160.40 billion.
- Throughout 2021, the company experienced an increase in revenue each quarter, starting at $162.90 billion in March to $174.08 billion in December.
- The upward trend continued into 2022; however, the acceleration slowed down from the first quarter ($177.11 billion), culminating in a slight increase between September ($180.45 billion) and December ($180.52 billion).
- A renewed surge can be observed in the first half of 2023, with revenue jumping to $183.03 billion in March and $186.13 billion in June.
Thus, over this period, CI has observed consistent growth in its revenue. The increase from the first recorded value to the last represents a growth rate of approximately 16%. Notably, the most significant fluctuation is seen between December 2022 and June 2023, where the growth seemed to recover momentum after a somewhat stagnant expansion in late 2022.
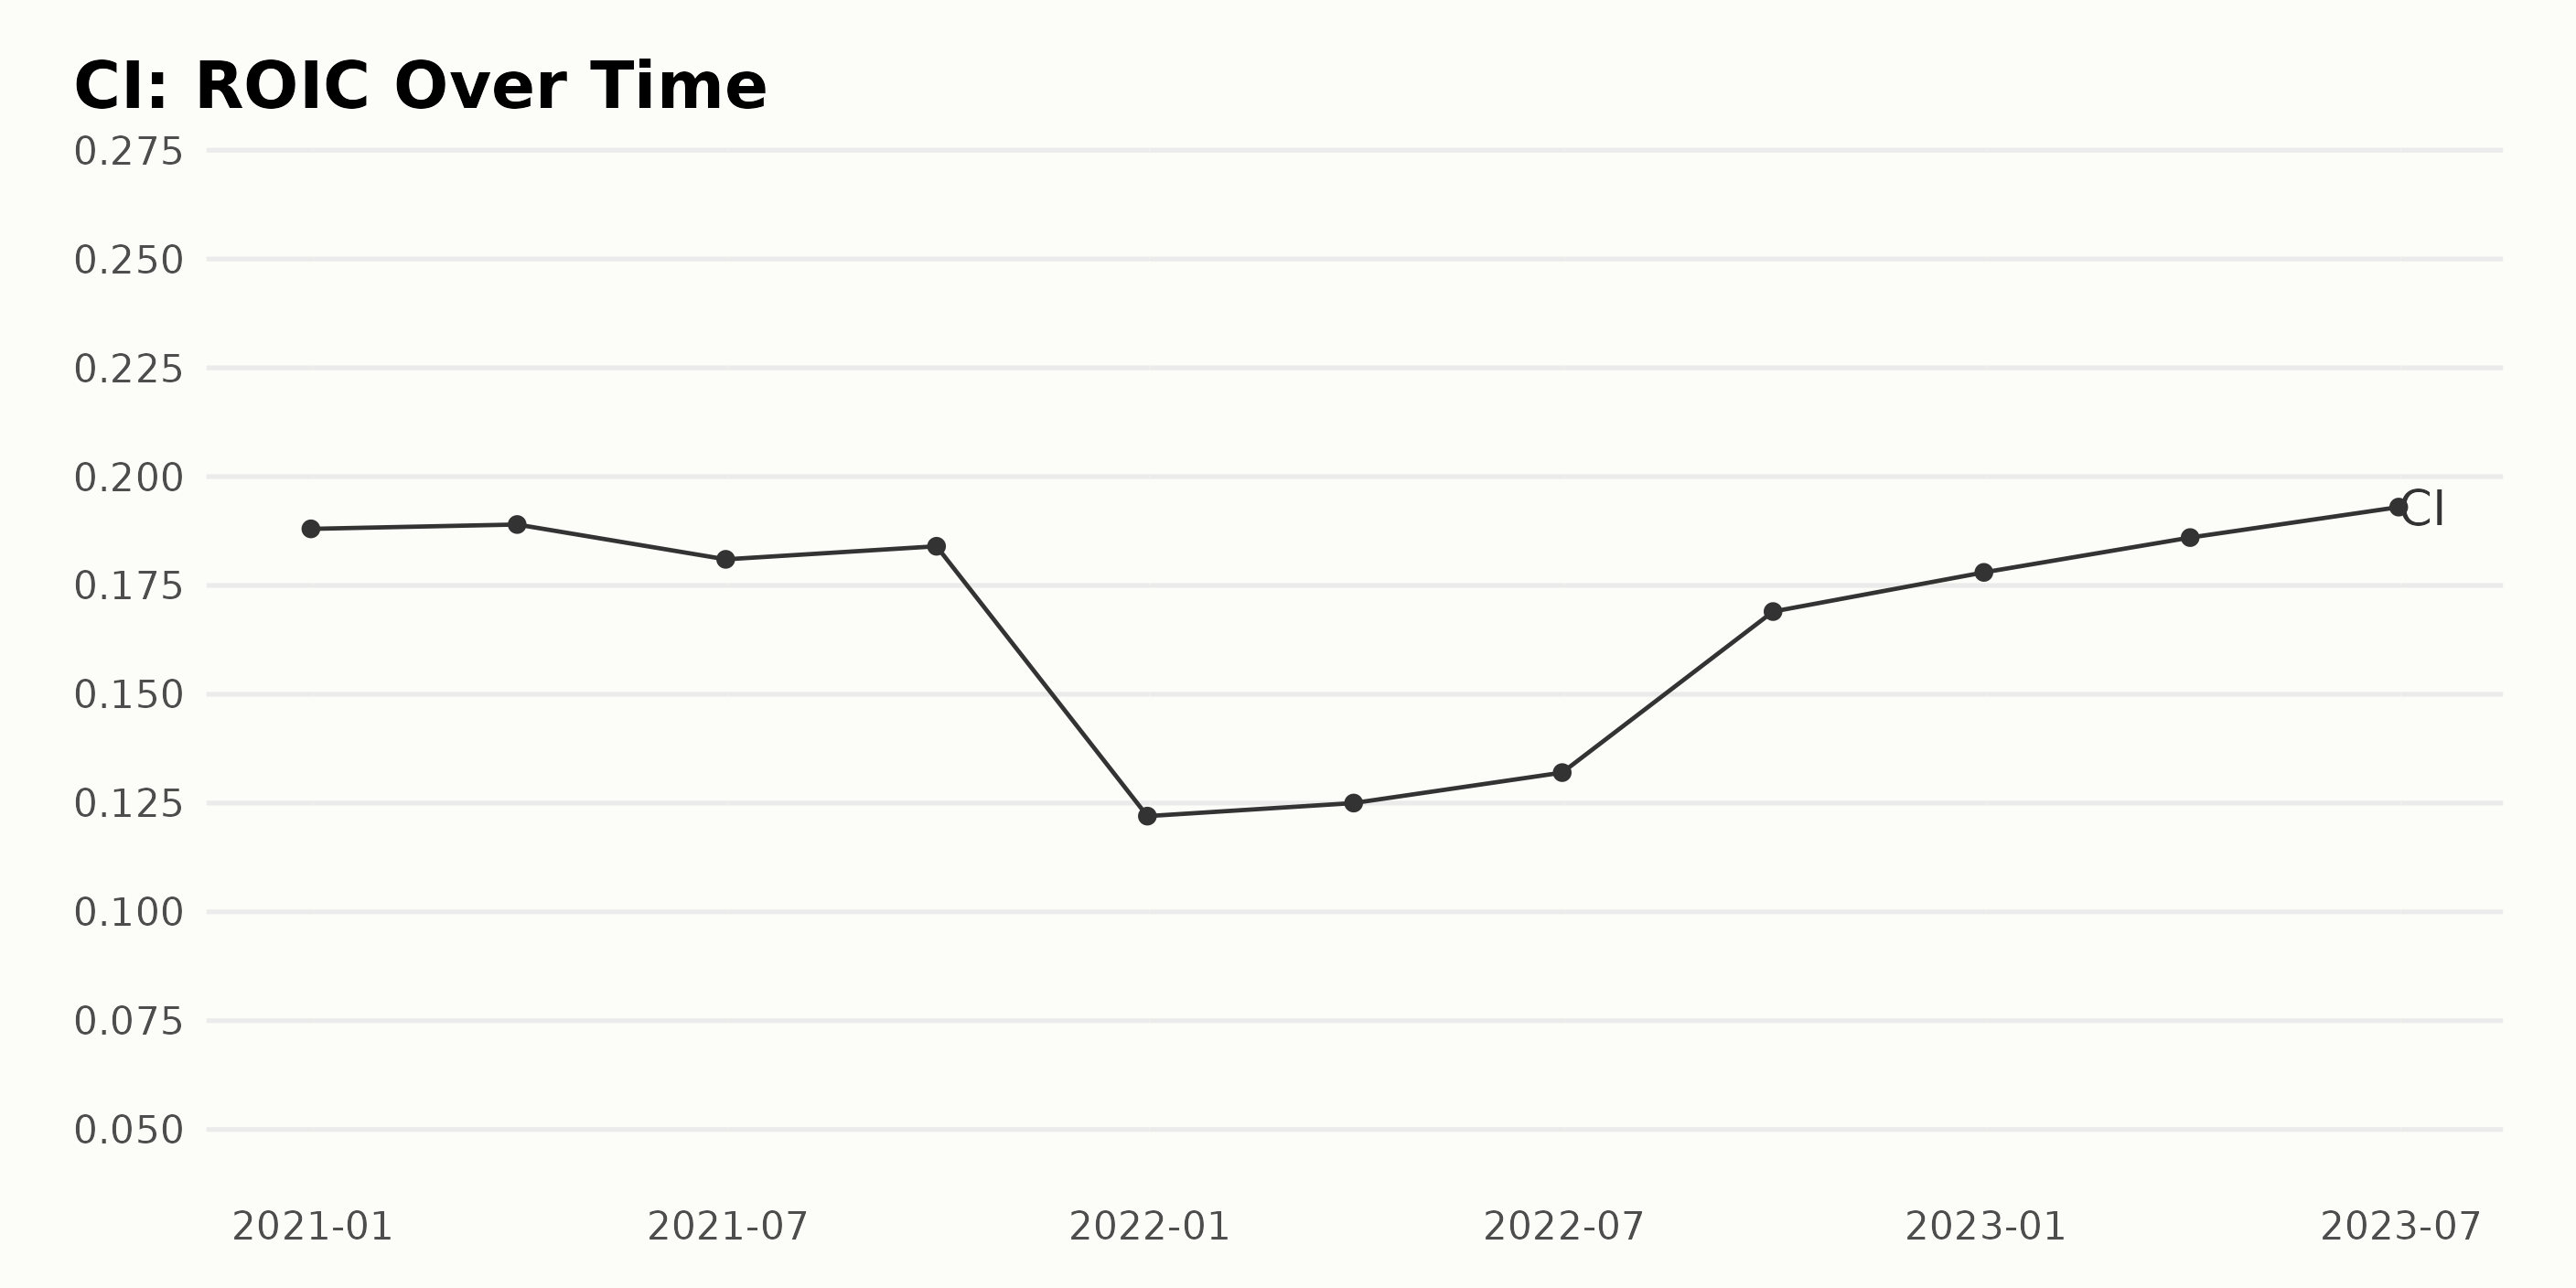
The historical summary for the Return On Invested Capital (ROIC) of CI shows a somewhat fluctuating trend with an overall slight upward pattern:
- Starting at a ROIC of 0.19 on December 31, 2020, the value somewhat fluctuates over the course of 2021, ending the year with a significant drop to 0.12 on December 31, 2021.
- The beginning of 2022 notes a subtle rise in the ROIC, from 0.13 in March to 0.17 by the end of September.
- As the year closes, there is a distinct increase in the ROIC to 0.18 by December 31, 2022.
- The first half of 2023 expresses an observable improvement, with the ROIC rising consistently to reach 0.19 by June 30, 2023.
Measuring the growth rate from the starting value (0.19 in December 2020) to the most recent value (0.19 in June 2023) indicates that the ROIC for CI experienced minor overall growth within this period, albeit with several fluctuations.
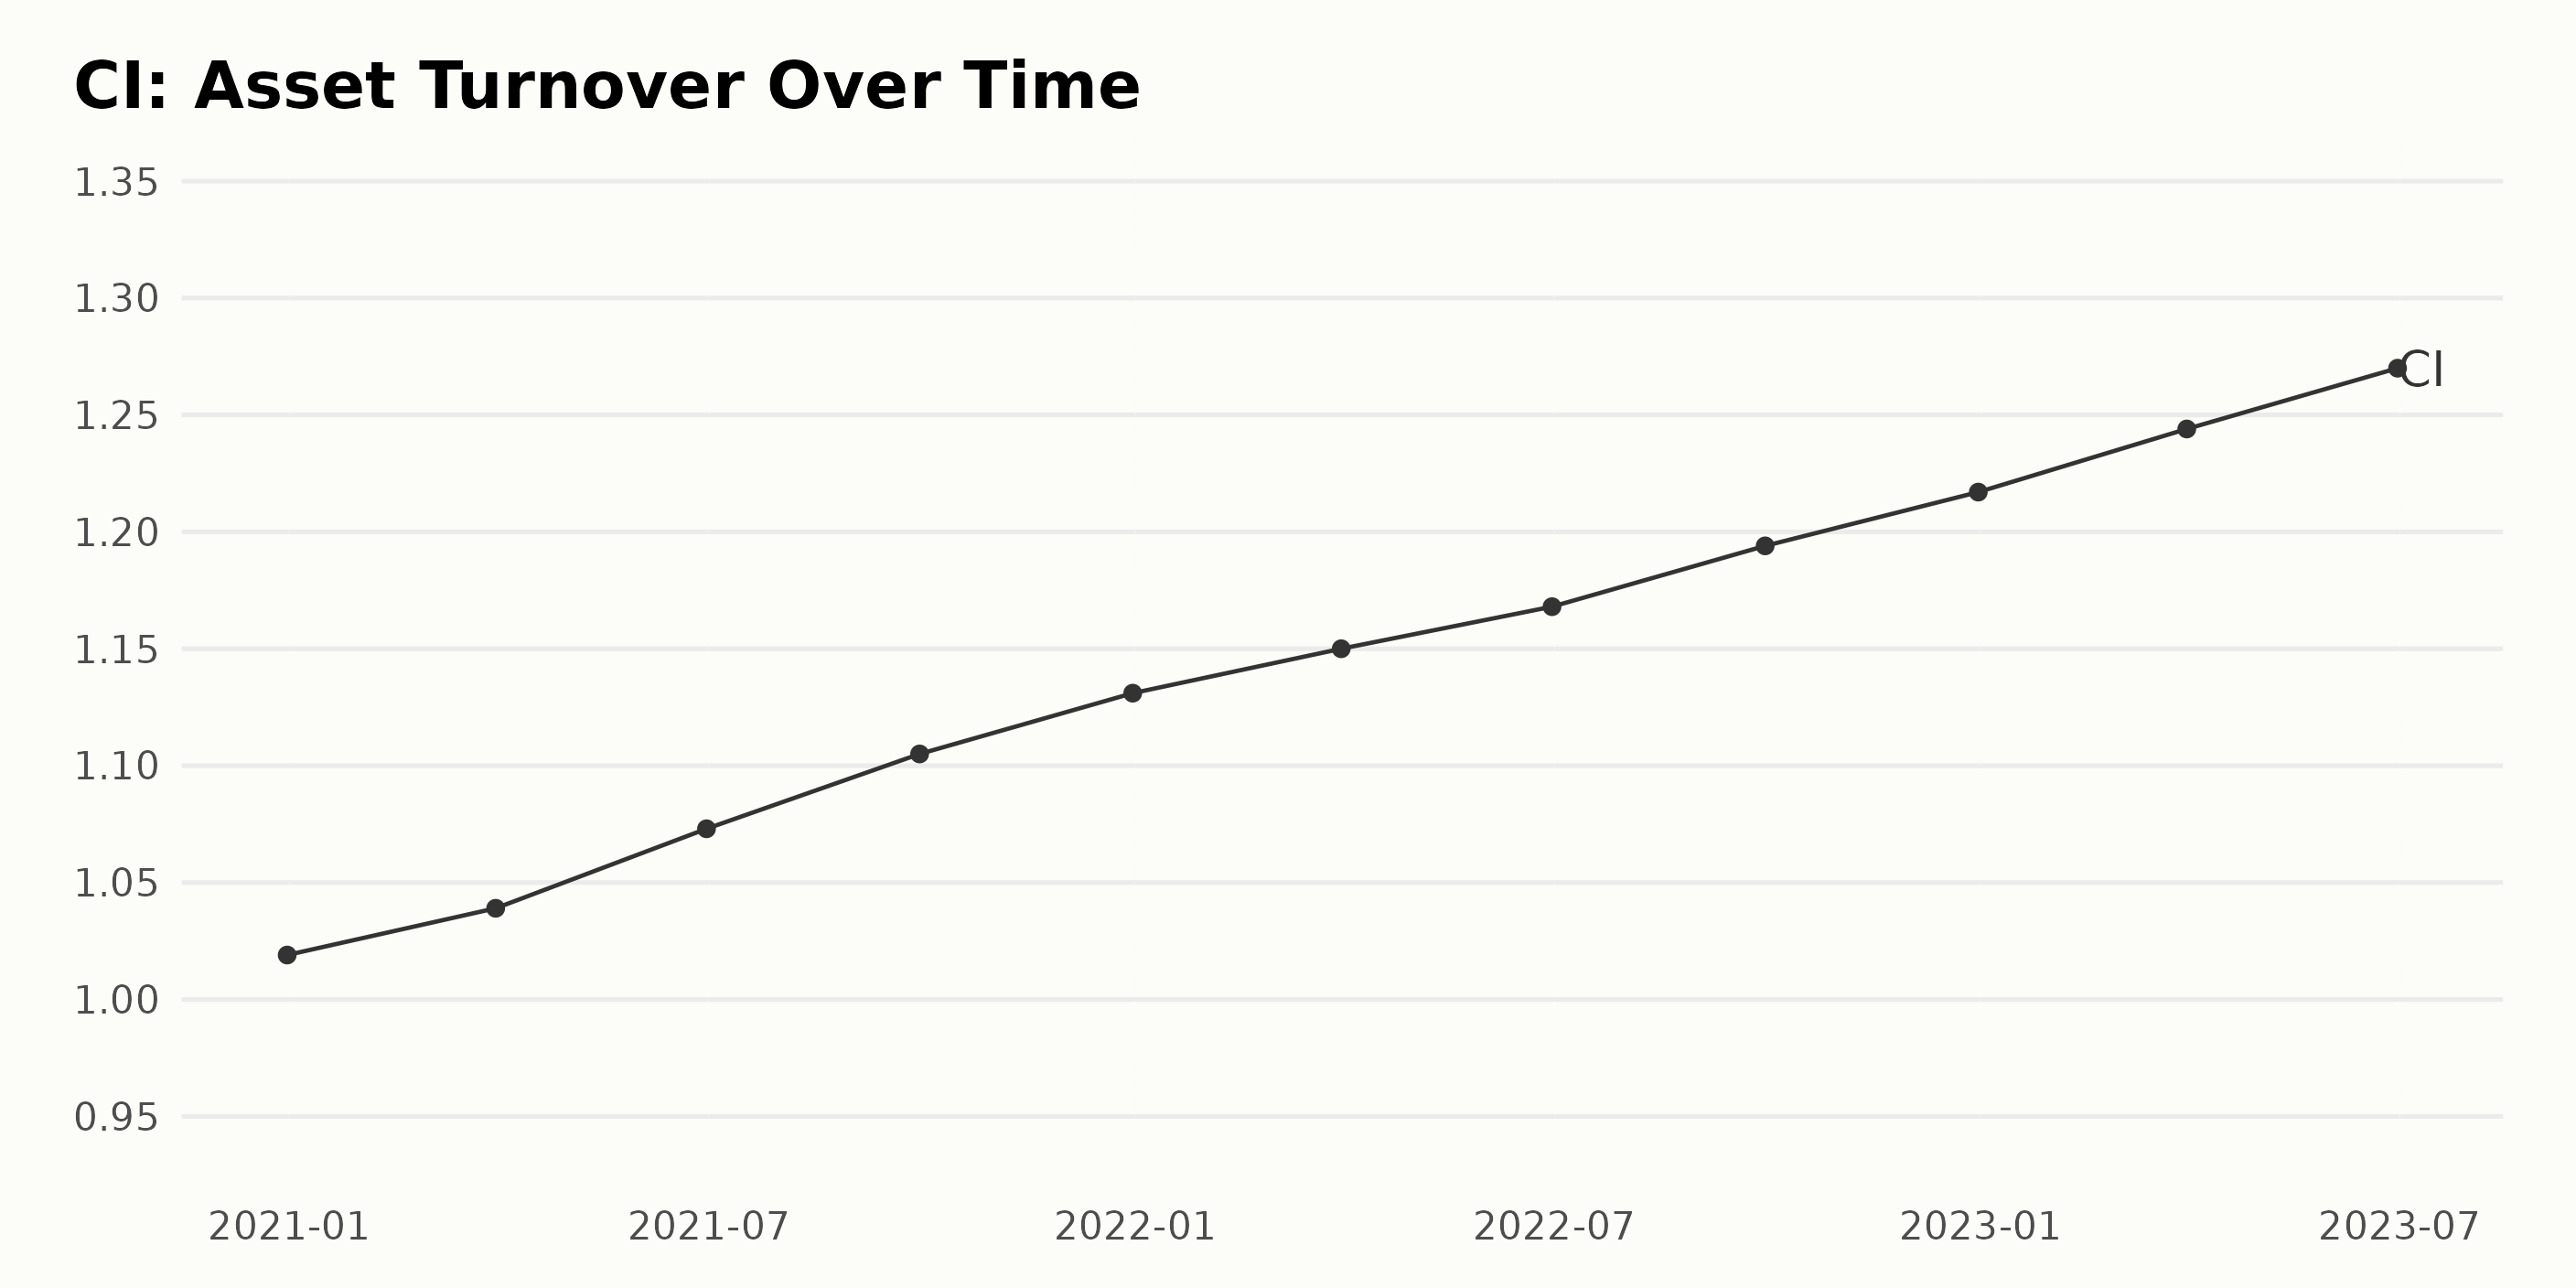
The asset turnover of CI displays an upward trend over the period 2020 to 2023, indicating an improvement in efficiency in asset cycling.
- At the outset, on December 31, 2020, the asset turnover was 1.02.
- The uptrend continued steadily throughout 2021, with an impressive growth rate, ending on a high note at 1.13 on December 31, 2021.
- All through 2022, CI maintained its ascendant trend, culminating in a record rise by the end of the year to 1.22 as of December 31, 2022.
- In continuation of the escalating trend from previous years, the asset turnover advanced notably in the first half of 2023, reaching 1.27 as of June 30, 2023.
Close examination of the data shows fluctuating growth rates between each measured period but an overall consistent upward trajectory. The most recent data from the year 2023 indicates that CI has managed to maintain this improving asset turnover performance.
From an overall perspective, from 2020 to 2023, there is a calculated growth rate of about 24.54%, which is a result of measuring the last value (1.27) from the first value (1.02).
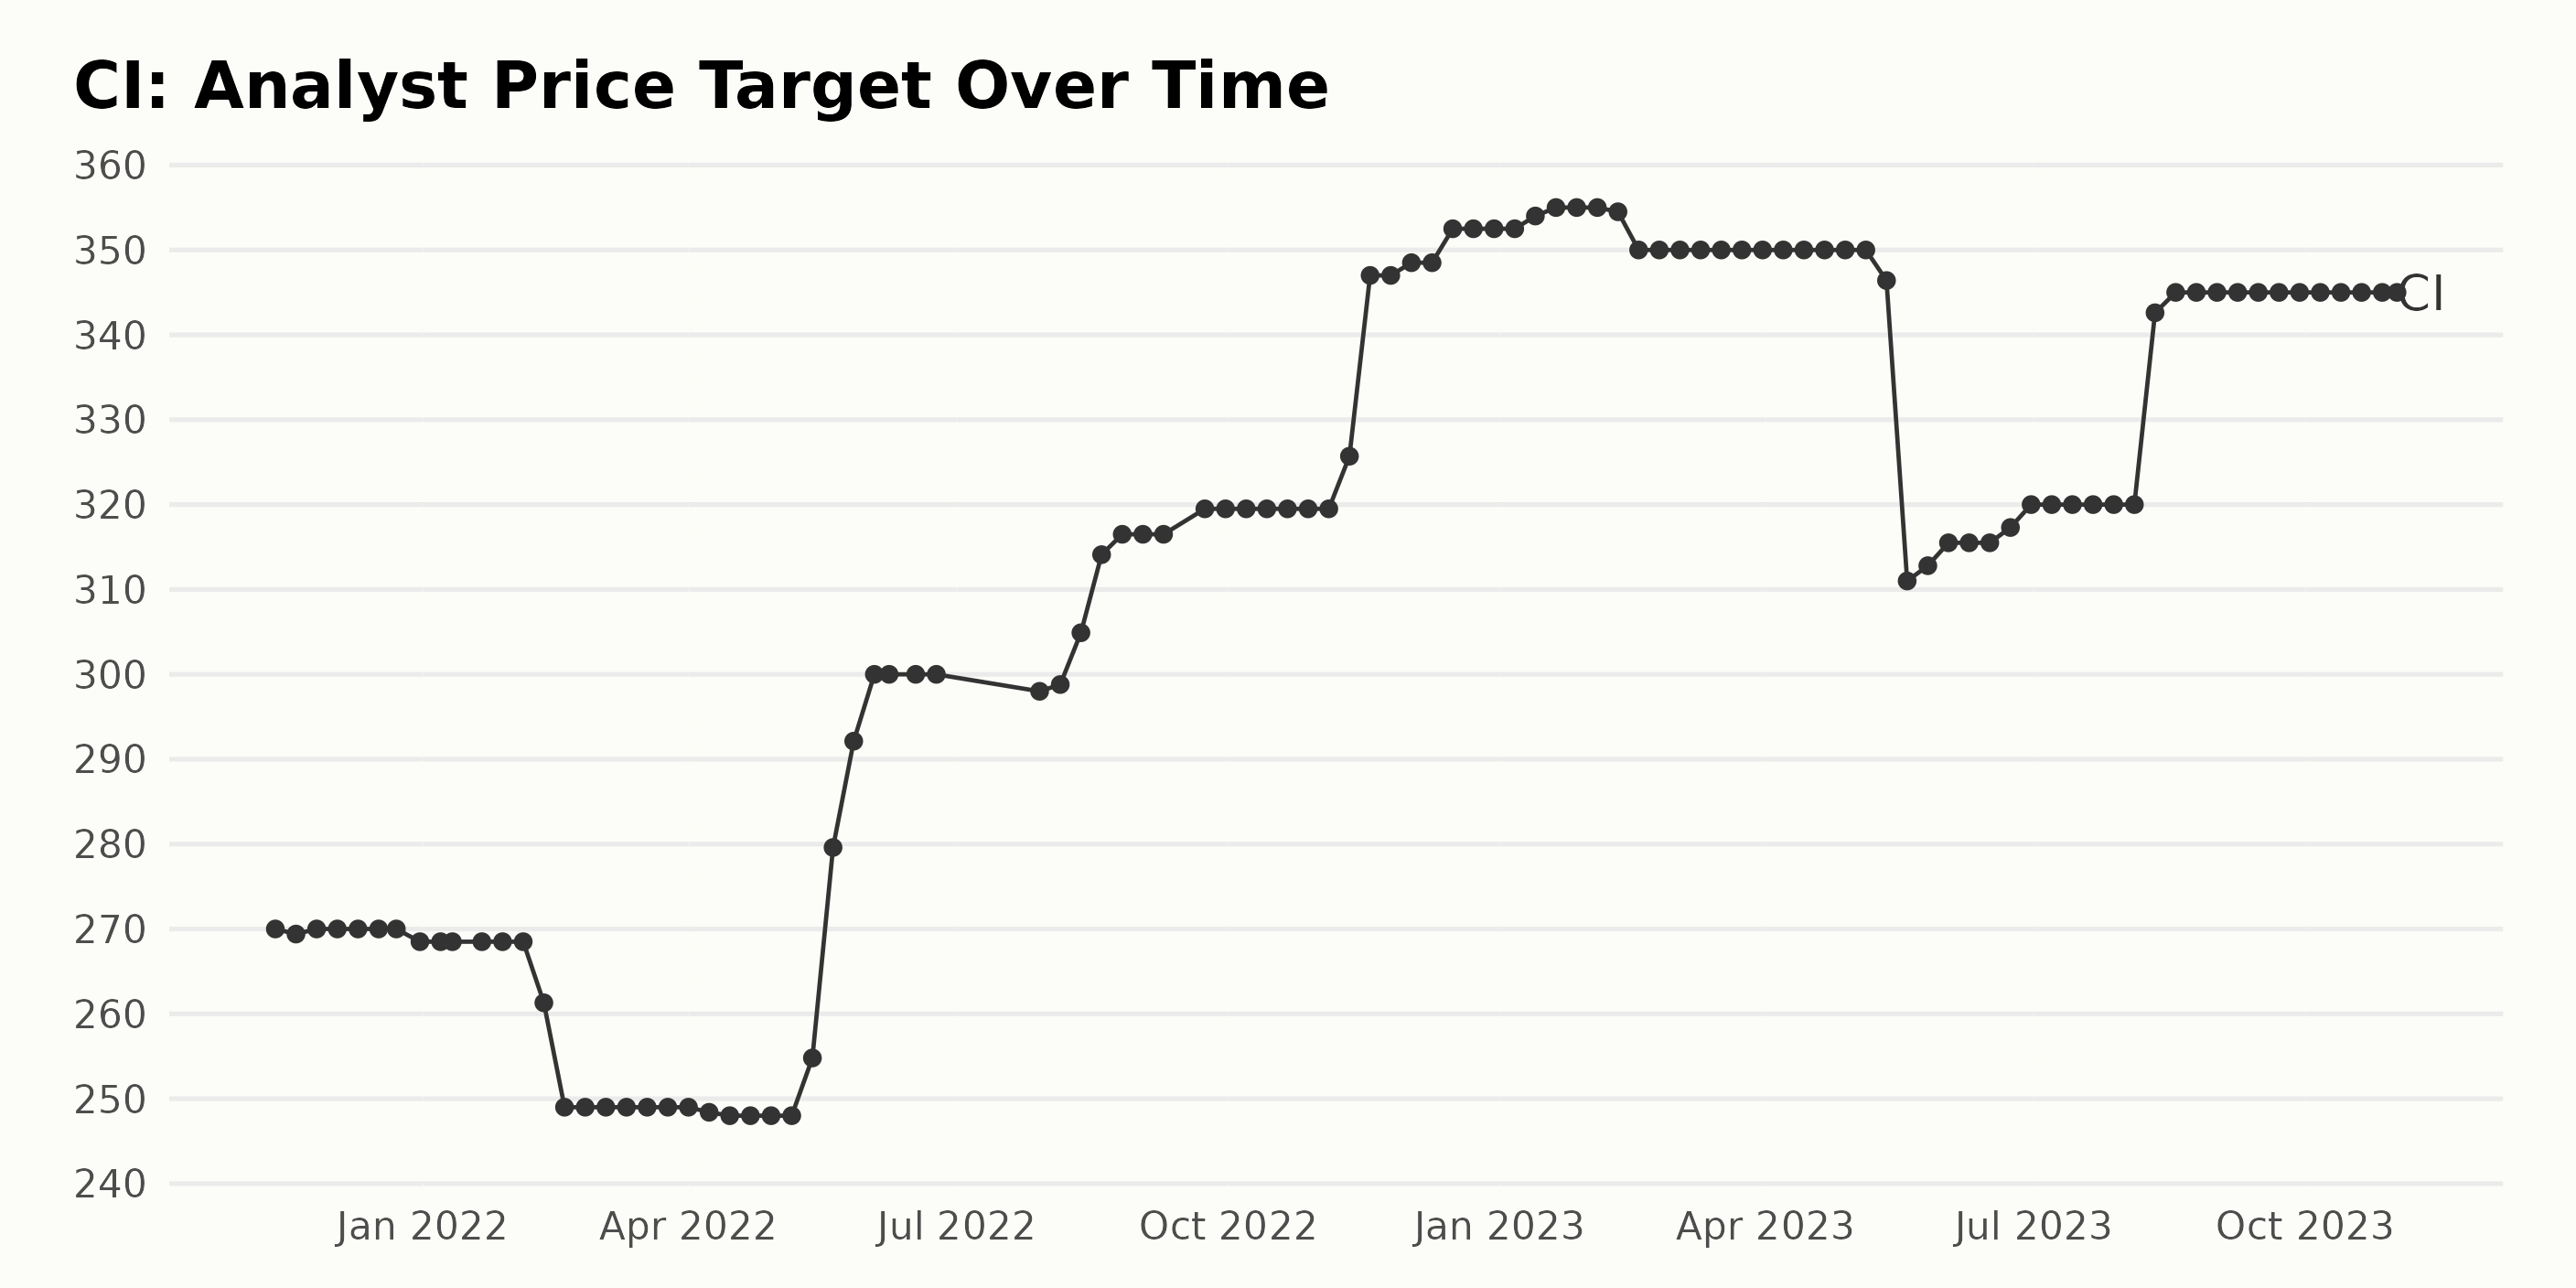
The data reflects the trend and fluctuations of the analyst price target for CI from November 2021 until November 2023. General Trend: The overall trend depicts an increase in the analyst price target for CI during this period. The initial value on November 12, 2021, was $270, and it progressed to $345 by November 1, 2023.
Key Fluctuations: Various notable fluctuations can be observed during the given period:
- The target price dropped slightly to $248 around mid-April 2022.
- It then rose sharply, peaking at $300 in early June 2022 before a minor drop near the end of July 2022.
- In August 2022, it began another upward trend, recording $319.5 in late October 2022.
- The target peaked again at $352.5 by the end of December 2022. Then, it steadily stayed around $350 until May 2023.
- Later, the target witnessed a major dip to $311 by mid-May 2023 but gradually regained its position, reaching $320 by the end of June 2023.
- Finally, there was a considerable rise again to $345 by late November 2023, which has been consistent since then.
The growth rate calculated from the first and last reported values results in a growth of approximately 27.78%, confirming the overall upward trend in the data. The emphasis is on the most recent data point: the analyst price target value for November 1, 2023, stands at $345. This is the highest value thus far and shows that analysts expect the value of CI to remain high in the future.
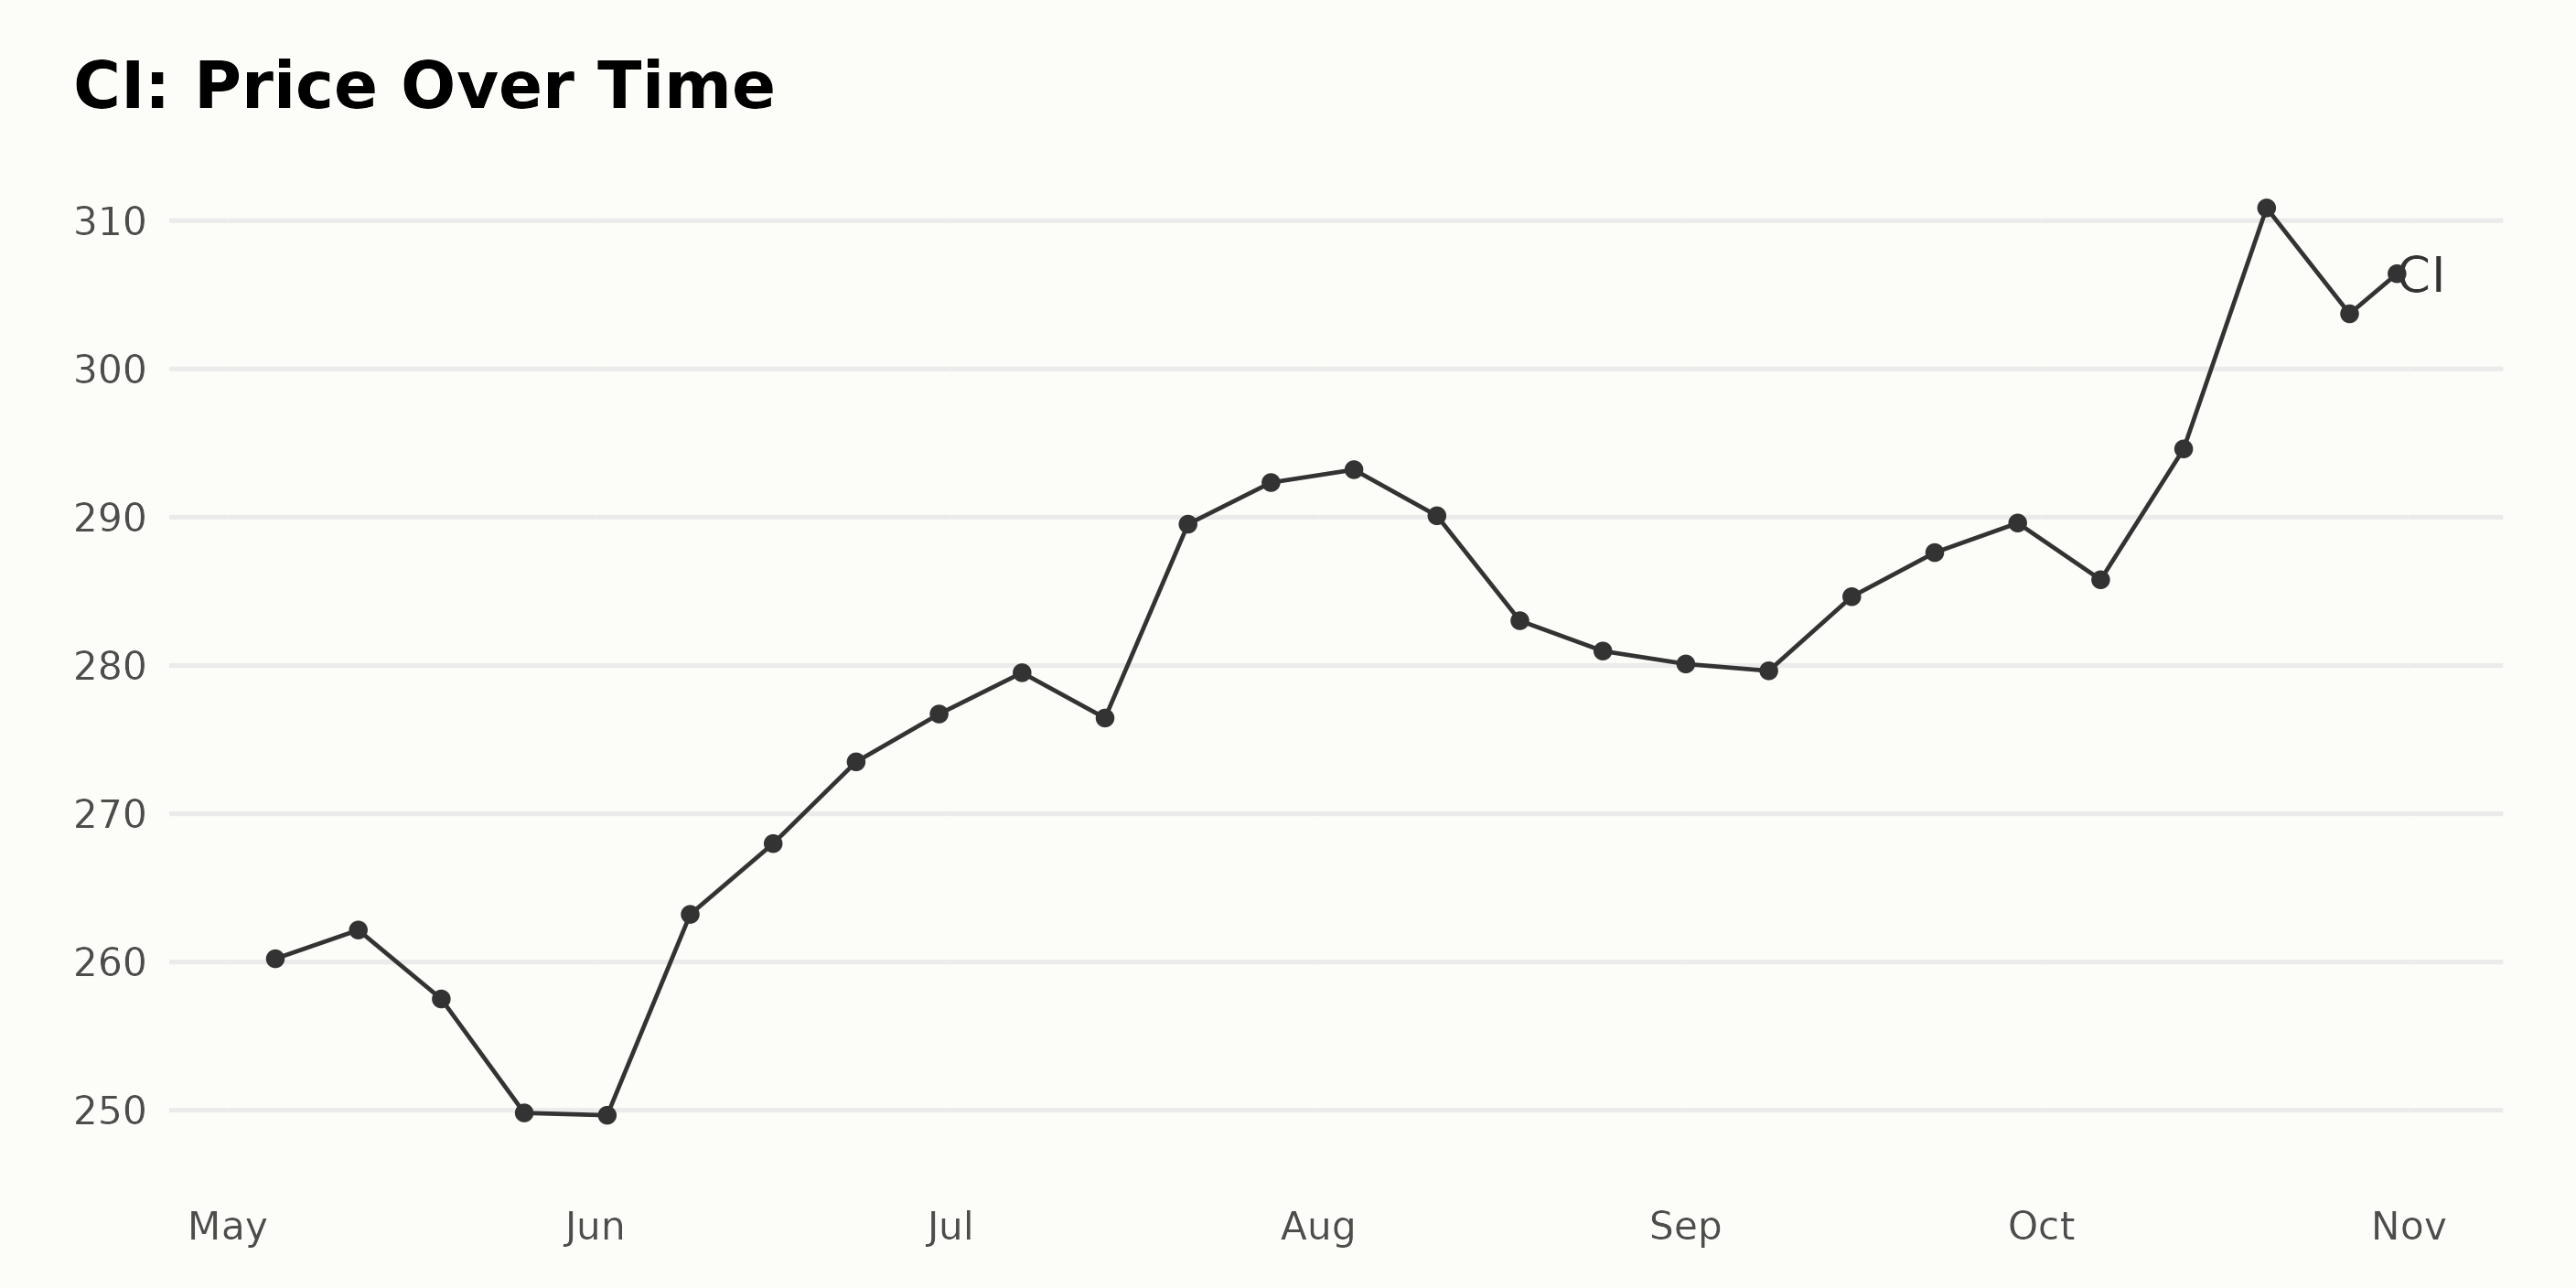
Chronological Analysis of Cigna's Share Price Fluctuations: May to October 2023
Analyzing the provided data in chronological order from May 2023 to October 2023, the following notable observations are made about CI:
- On May 5, 2023, the share price of CI was $260.22.
- There was a slight increase in the share price to $262.16 on May 12, 2023, which marked a decline over the subsequent weeks as the share price fell to $249.66 by June 2, 2023.
- The month of June saw an upward trend in CI's share price, starting at $249.67 on June 2, 2023, and achieving a relative peak of $276.73 by June 30, 2023.
- July continued the upward trend from June, reaching the highest point at $292.34 by the end of the month.
- However, August experienced a generally declining trend - although not sharply - where the value diminished to $280.97 by August 25, 2023, despite a brief rise to $293.21 at the start of the month.
- Both September and October showed a mostly increasing trend with some fluctuations. By October 20, 2023, the share price reached its highest recorded point of $310.86 before falling slightly to end at $309.20 on October 31, 2023.
Over this period, there is an overall rising trend in CI share price, albeit with noticeable weekly fluctuations. There doesn't appear to be a clear accelerating or decelerating growth rate, instead, the shares show a pattern of variability while maintaining an overarching increase during this particular time frame. Here is a chart of CI's price over the past 180 days.
Analyzing Cigna's POWR Ratings: Value, Quality, and Stability Trends
The POWR Ratings Grade for CI, a stock in the Medical - Health Insurance category, has shown fluctuations over a certain period. Here is a summarized report of the POWR Grade and its rank in the category:
- Starting from May 6, 2023, CI had a POWR grade of B (Buy) and was ranked #6 among the 11 stocks in its category.
- The POWR grade improved to A (Strong Buy) on May 13, 2023, and its ranking improved to #5.
- This A (Strong Buy) grade persisted for a major part of May and the entire month of June and July. Its ranking fluctuated between #6 and #4 during May and then stabilized at #4 from June through July.
- In August 2023, aside from maintaining an A (Strong Buy) grade for the first week and improving its ranking to #3, it downgraded to B (Buy) for the remaining weeks, with the rank being consistent at #4.
- The POWR grade B (Buy) continued from September through October with a rank that varied between #5 and #6.
- As of the latest data available, on November 1, 2023, CI held a POWR grade of B (Buy) and was ranked #5 in its category.
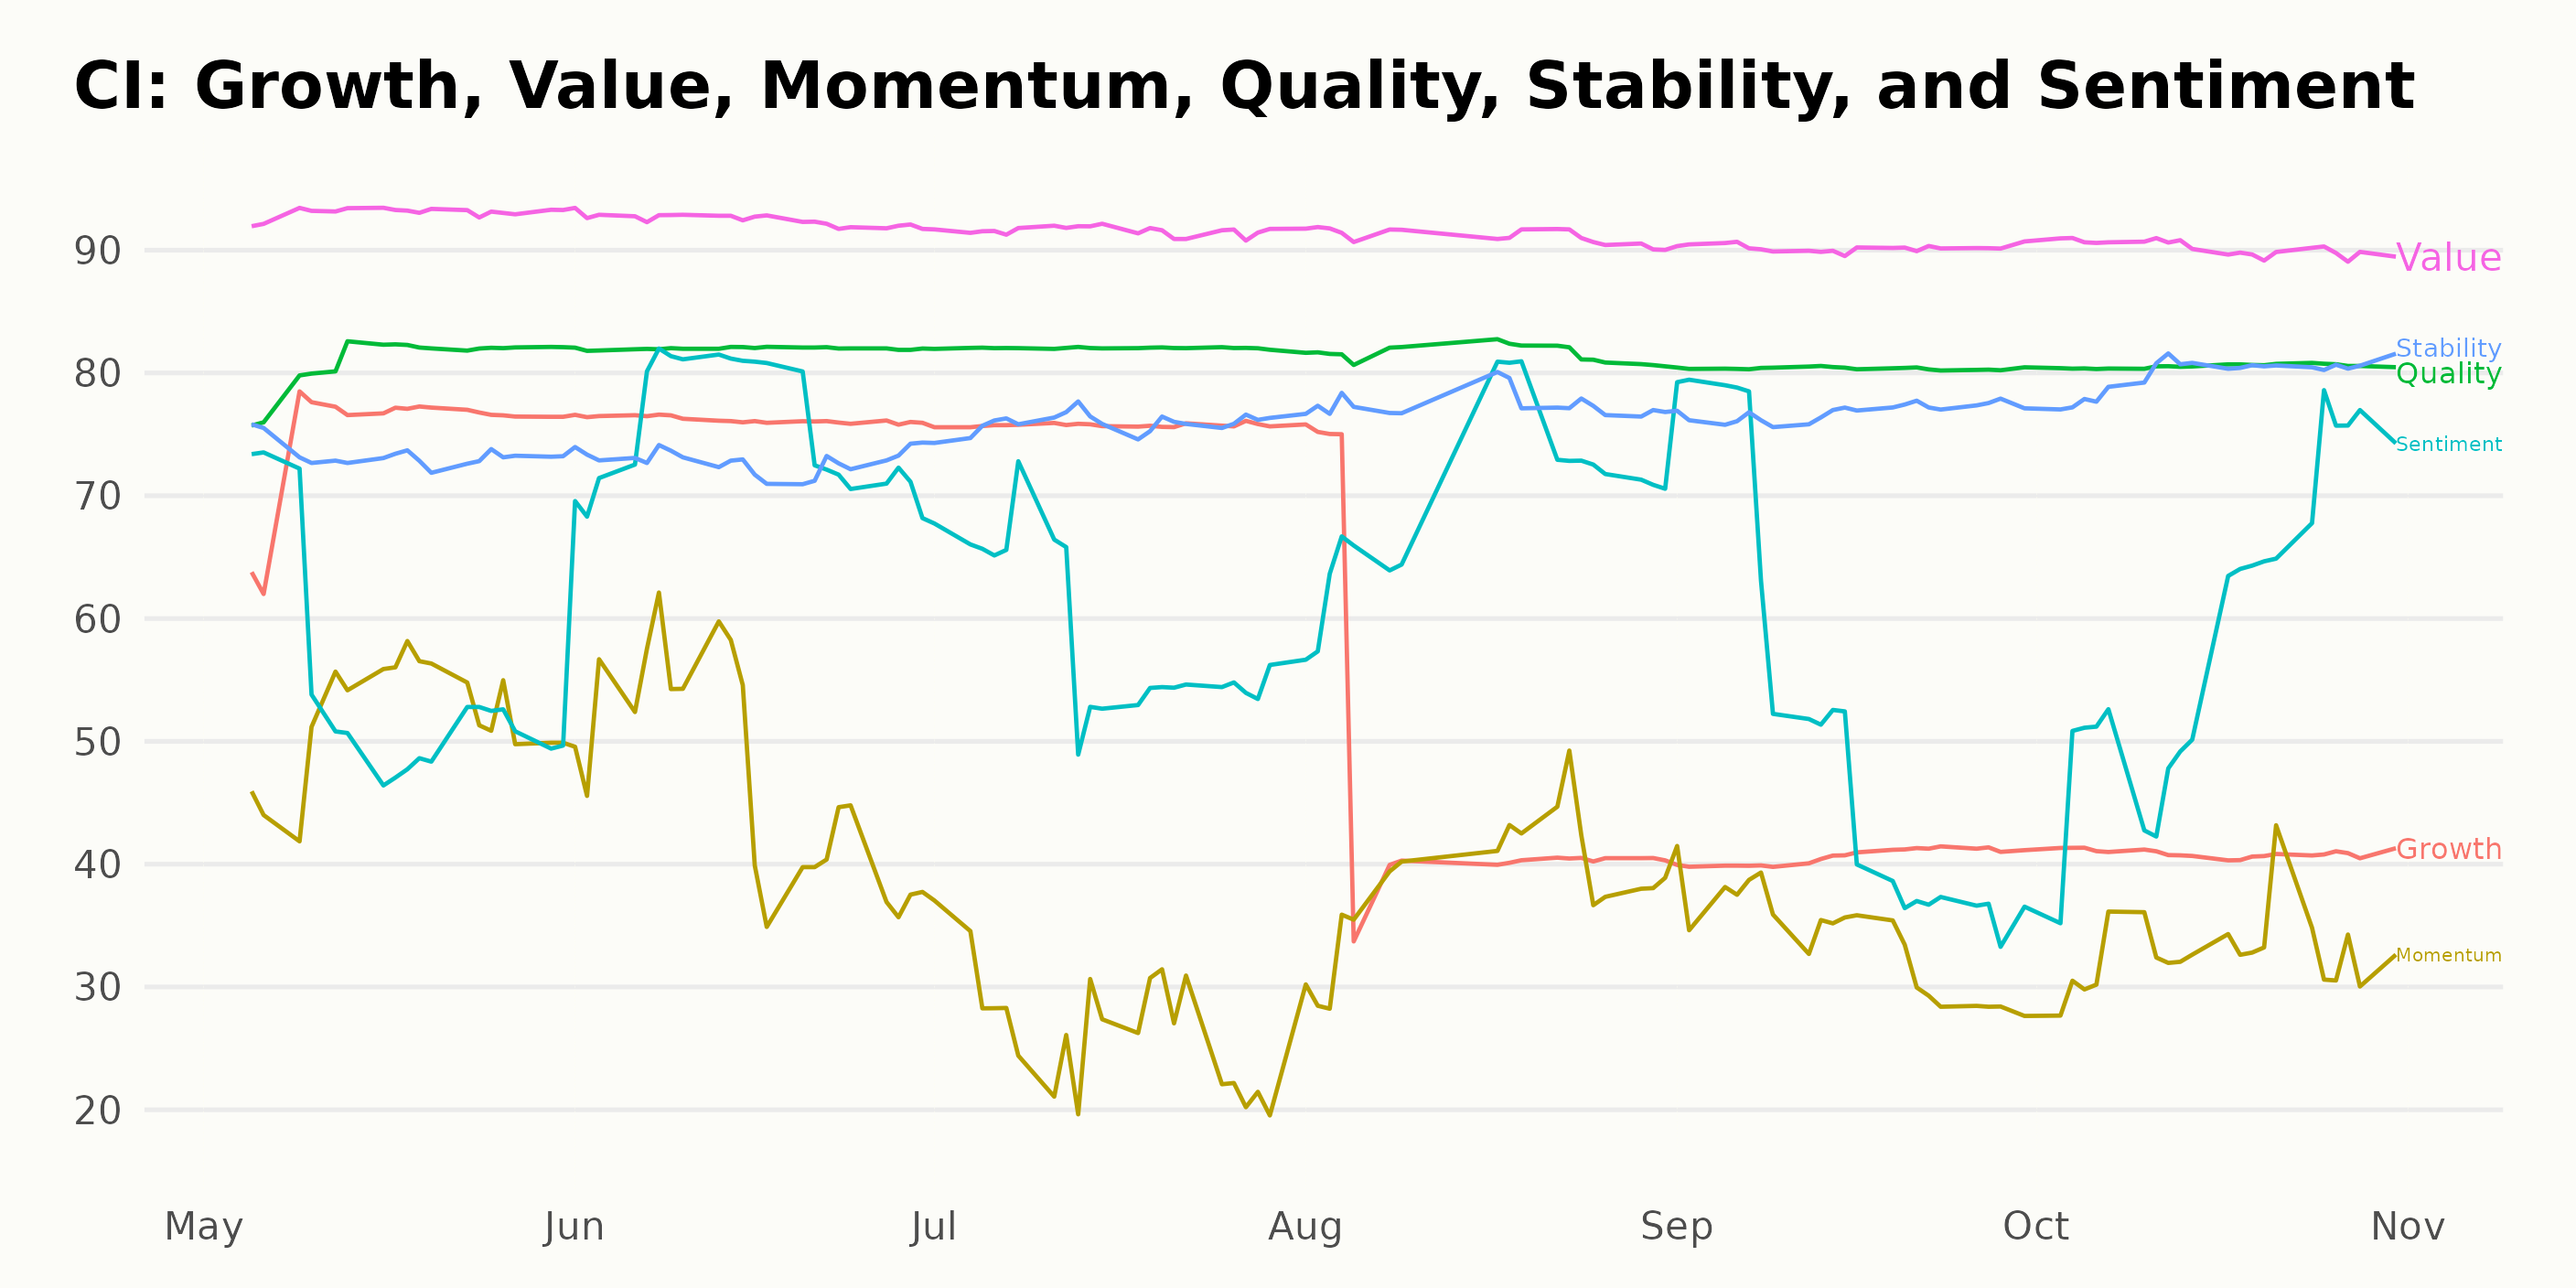
Let's evaluate the POWR Ratings for CI by focusing on the three most noteworthy dimensions: Value, Quality, and Stability.
Value: CI consistently receives the highest ratings in this category, hovering in the 90-93 range throughout the period from May to October 2023. This suggests that the market perceives CI as having good value. There is a slight but steady decrease over this period, with ratings going from 93 in May 2023 to 90 in October 2023.
- In May 2023, the Value rating was 93.
- In October 2023, the Value rating declined slightly to 90.
Quality: CI also performs exceptionally well in this category, with scores ranging from 80 to 82 within the same period. There's an increase in rating from May to June 2023, and then it somewhat plateaued for the subsequent period, maintaining consistency in perceived quality.
- In May 2023, the Quality rating was 81.
- By October 2023, despite slight fluctuations, the rating remained more or less consistent at 81.
Stability: Ratings for this attribute had a gradual uptrend from 73 in May 2023 to 80 in October 2023, which indicates increased stability for CI over the measured time span.
- In May 2023, Stability was rated at 73.
- By October 2023, the Stability rating saw a clear upward trend, reaching 80.
From this data, we can infer that throughout this period, CI was viewed positively in terms of its Value, Quality, and Stability in the market. Its strongest dimension is Value, followed closely by Quality, while its Stability trended upward over this time span.
How Does The Cigna Group (CI) Stack Up Against its Peers?
Other stocks in the Medical - Health Insurance sector that may be worth considering are Centene Corporation (CNC), Molina Healthcare, Inc. (MOH), and Elevance Health, Inc. (ELV) - they have better POWR Ratings. Click here to explore more Medical - Health Insurance stocks.
What To Do Next?
Get your hands on this special report with 3 low priced companies with tremendous upside potential even in today’s volatile markets:
3 Stocks to DOUBLE This Year >
CI shares were trading at $308.82 per share on Wednesday afternoon, down $0.38 (-0.12%). Year-to-date, CI has declined -5.54%, versus a 11.09% rise in the benchmark S&P 500 index during the same period.
About the Author: Anushka Dutta

Anushka is an analyst whose interest in understanding the impact of broader economic changes on financial markets motivated her to pursue a career in investment research.
The post Cigna (CI): Buy, Hold, or Sell Before Earnings Call? appeared first on StockNews.com