
It’s been a volatile week for silver (SLV), with the metal looking like it would finally take out $26.55/oz resistance, only to be slammed back below this key level to finish last week. This significant rejection has killed short-term momentum for the time being, with the bear brigade showing up right when silver was its more vulnerable, with the bullish sentiment above 90%.
Fortunately, while the short-term picture remains muddled, this recent correction has helped to wash out sentiment a little, with bullish sentiment falling back below 70% bulls and away from a brief reading of extreme optimism. However, while the long-term picture remains bullish above $22.00/oz, the bulls are going to want to start playing defense immediately to rule out a re-test of this lower support area. Let’s take a closer look below:
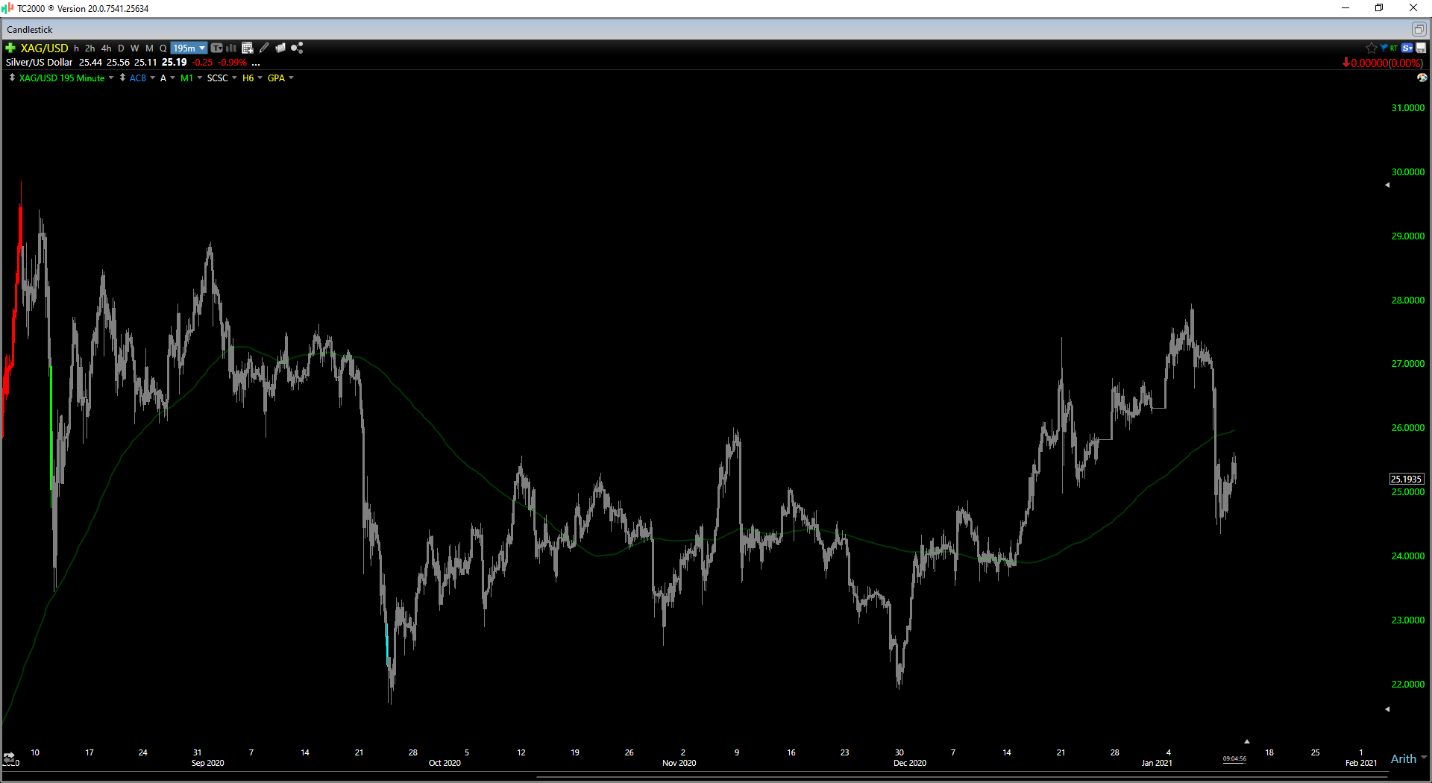
(Source: TC2000.com)
As shown in the chart below of sentiment, silver got very over-heated on Thursday’s close, pushing to a reading of 91% bulls. This is generally a short-term sell signal, as it’s never a good sign to see nine bulls for every one bear in the market. Since then, we’ve seen a nearly 10% correction in the metal in the span of just three trading days, with silver being violently pushed back into negative territory year-to-date. However, while this has certainly not been pleasant for those on margin and those buying aggressively near support, there is some good news from this recent spike in extreme optimism.
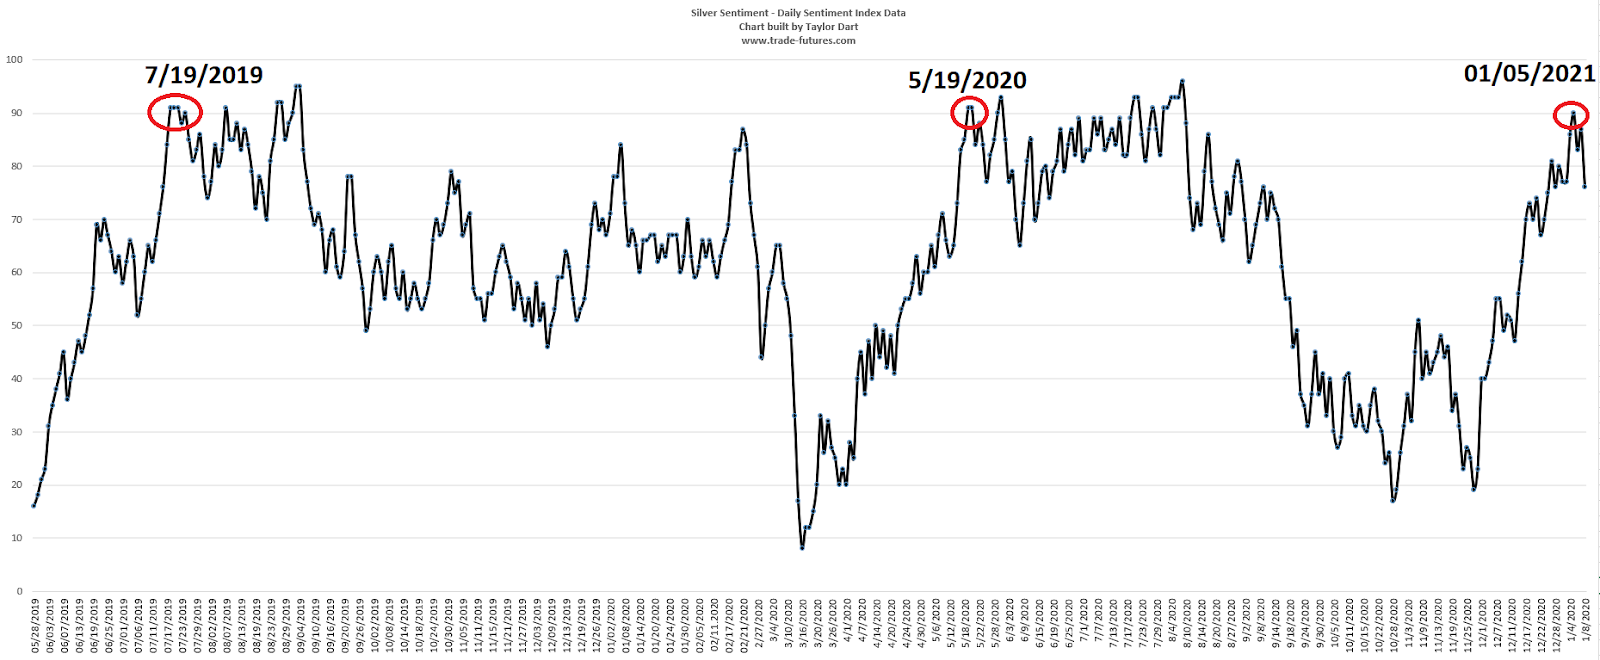
(Source: Daily Sentiment Index Data, Author’s Chart)
As we can see above, the first extreme optimism reading after a sharp correction is typically a medium-term buy signal, even if it is a short-term sell signal, because greed tends to beget more greed. This means that while a 5-10% drawdown is normal after a reading of more than 90% bulls, the 2-3 month return is actually quite bullish.
Unfortunately, the shakeout preceding this return often dislodges investors’ positions if they aren’t aware that this is the case. To illustrate this point, we can look at July 19th, 2019, and May 19th, 2020 on the below chart, with these dates coinciding with the first reading of extreme optimism following a 20%+ correction.

(Source: TC2000.com)
If we look at the long-term chart above of silver, we can see that silver fell by nearly 10% over two weeks following August 19th, 2019, but then soared by over 20% from that ensuing pullback over the next two months. In the case of May 19th, 2020, silver fell just over 5% in less than a week but then nearly doubled over the next three months. While there’s no guarantee that this signal plays out similarly, this is exactly how the last two readings have played out.
However, the caveat is that the correction in both cases for silver did not exceed 10%. Therefore, this current correction is already slightly abnormal. For this reason, to maintain this view, we will want to see the recent lows at $24.30/oz hold in silver at all costs.
Unfortunately, a break of this low would be a deviation from the past pattern and suggest that it may not play out similarly to the previous pattern of a sharp 1-week correction, following by a massive run over the next 30-50 trading days.
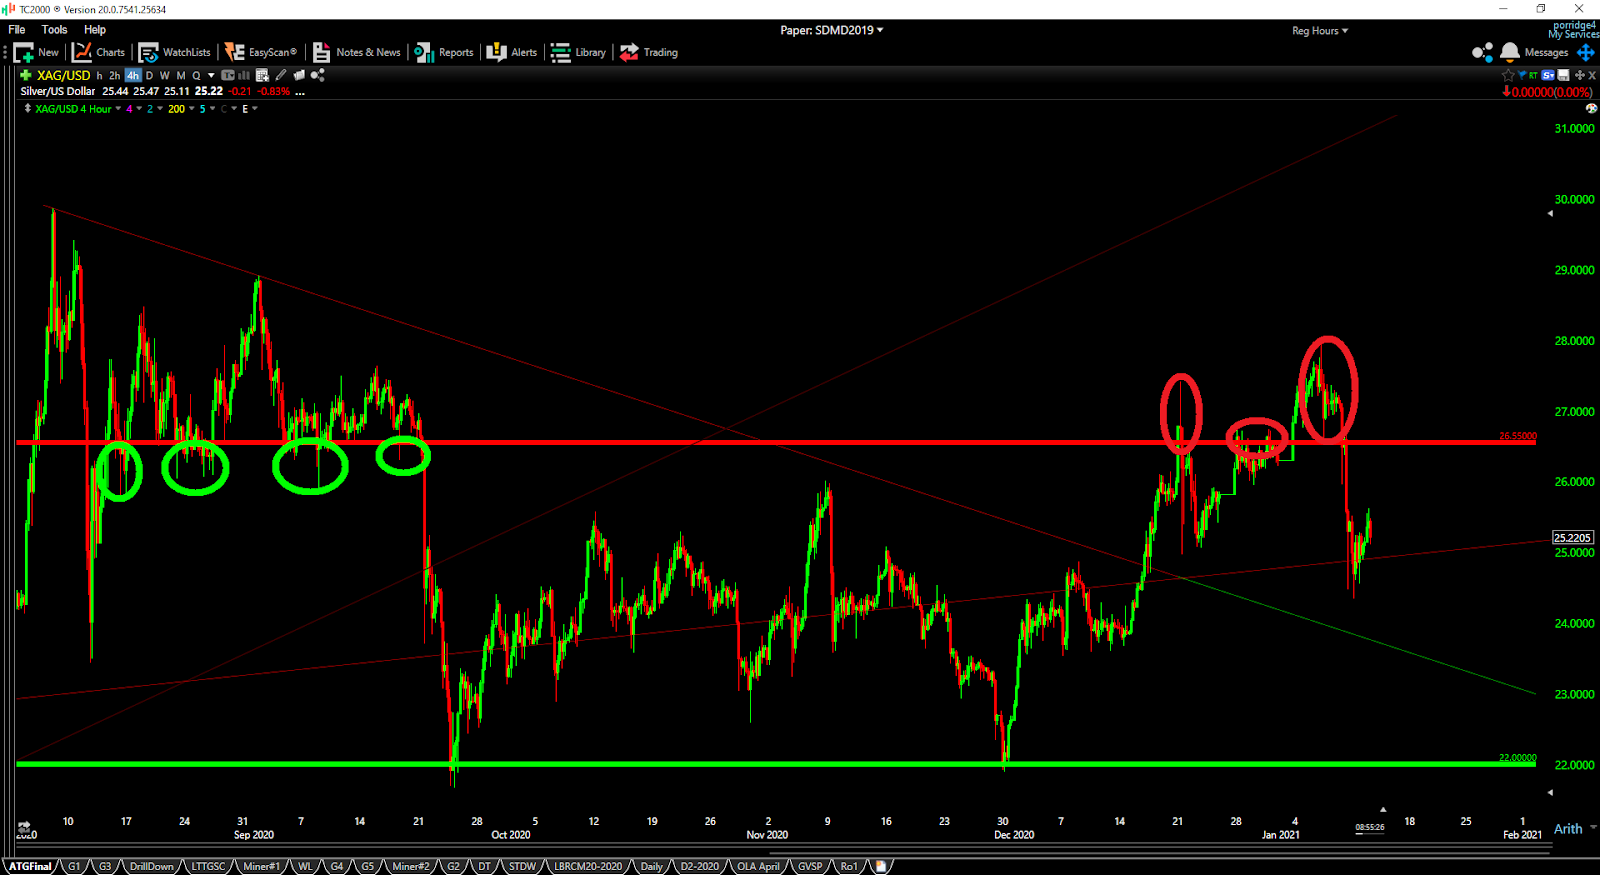
(Source: TC2000.com)
Moving over to the technical picture, we can see that the $26.55/oz level continues to be a brick wall for the bulls, but we still have a trend of higher lows and higher highs in place since December. While we briefly made a lower low on silver vs. the late December rally, we are above the key low at $23.50/oz from mid-December, and this a must-defend level for the bulls. If we look at the below weekly chart, this is also a key level as it keeps the cup & handle pattern alive.
Therefore, while further choppy action is not the end of the world, we want to see $24.25/oz be the low of this correction, and in a worst-case scenario, $23.75/oz, to force a higher low. If $23.75/oz breaks, this will increase the probability of silver heading all the way back down to $21.50/oz to $22.00/oz.
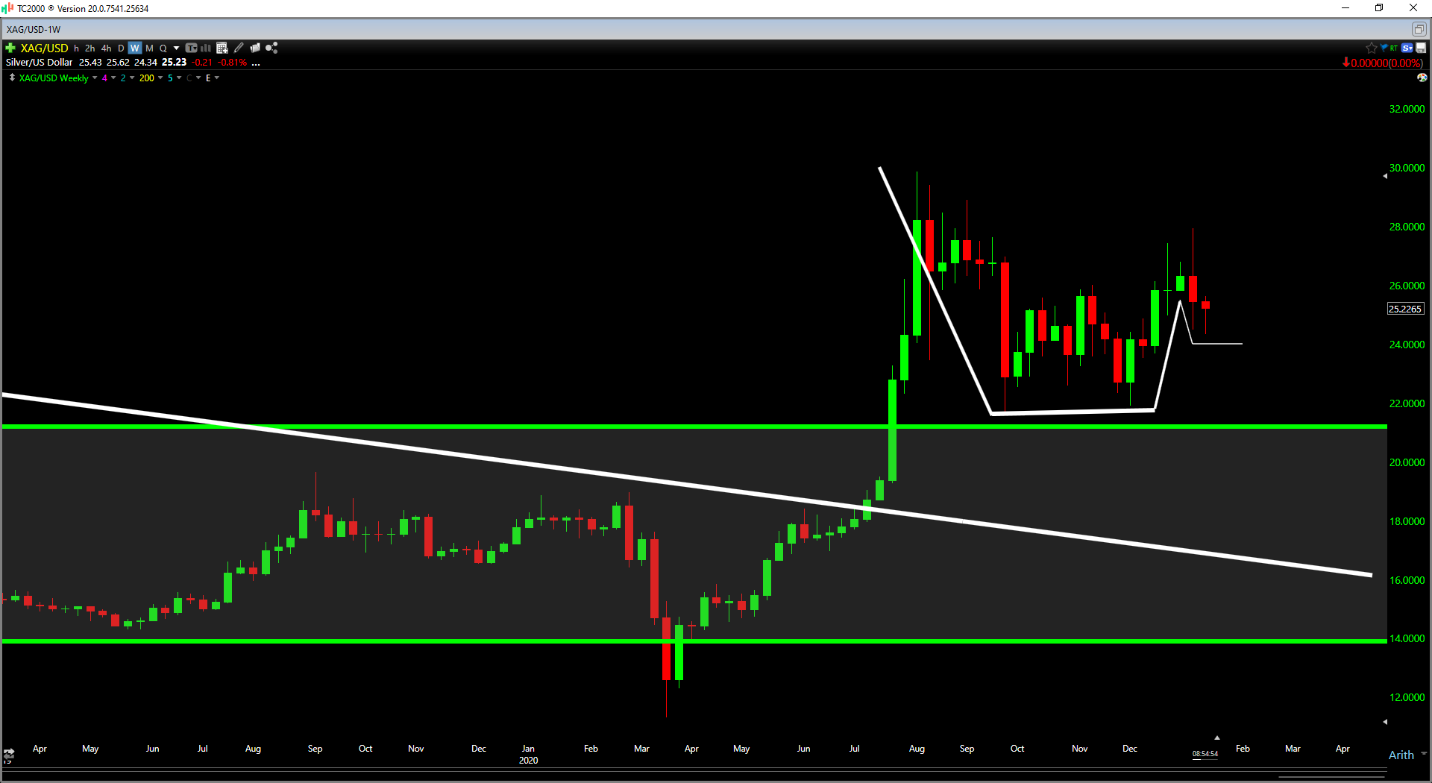
(Source: TC2000.com)
So, what’s the best course of action?
Given that I have minimal exposure to the silver space currently, I used the recent correction to add to one of my silver miners, Wheaton Precious Metals (WPM), but I am maintaining relatively light exposure for the time being. This is because we continue to trade in a choppy range with no clear direction, even if the bulls do have the upper hand on the long-term chart.
If we were to see a breakout and weekly close above $26.55/oz, this would significantly increase the probability of new highs, and I would look to add some exposure to silver. However, until this occurs, I see no reason to be aggressive because this choppy range will lead to higher volatility and an increased probability of being stopped out of new positions.
Disclosure: I am long GLD, WPM
Want More Great Investing Ideas?
9 “MUST OWN” Growth Stocks for 2021
SLV shares rose $0.34 (+1.46%) in premarket trading Tuesday. Year-to-date, SLV has declined -4.72%, versus a 1.28% rise in the benchmark S&P 500 index during the same period.
About the Author: Taylor Dart

Taylor has over a decade of investing experience, with a special focus on the precious metals sector. In addition to working with ETFDailyNews, he is a prominent writer on Seeking Alpha. Learn more about Taylor’s background, along with links to his most recent articles.
The post Silver Nears Important Technical Levels appeared first on StockNews.com