

Modular home and building manufacturer Champion Homes (NYSE: SKY) reported Q2 CY2025 results exceeding the market’s revenue expectations, with sales up 11.7% year on year to $701.3 million. Its non-GAAP profit of $1.19 per share was 46.9% above analysts’ consensus estimates.
Is now the time to buy Champion Homes? Find out by accessing our full research report, it’s free.
Champion Homes (SKY) Q2 CY2025 Highlights:
- Revenue: $701.3 million vs analyst estimates of $640.7 million (11.7% year-on-year growth, 9.5% beat)
- Adjusted EPS: $1.19 vs analyst estimates of $0.81 (46.9% beat)
- Adjusted EBITDA: $94.18 million vs analyst estimates of $67.63 million (13.4% margin, 39.3% beat)
- Operating Margin: 11.2%, up from 8.8% in the same quarter last year
- Free Cash Flow Margin: 9.5%, down from 11.8% in the same quarter last year
- Sales Volumes rose 6.5% year on year (35.7% in the same quarter last year)
- Market Capitalization: $3.75 billion
Company Overview
Founded in 1951, Champion Homes (NYSE: SKY) is a manufacturer of modular homes and buildings in North America.
Revenue Growth
Examining a company’s long-term performance can provide clues about its quality. Any business can experience short-term success, but top-performing ones enjoy sustained growth for years. Thankfully, Champion Homes’s 15% annualized revenue growth over the last five years was incredible. Its growth beat the average industrials company and shows its offerings resonate with customers.
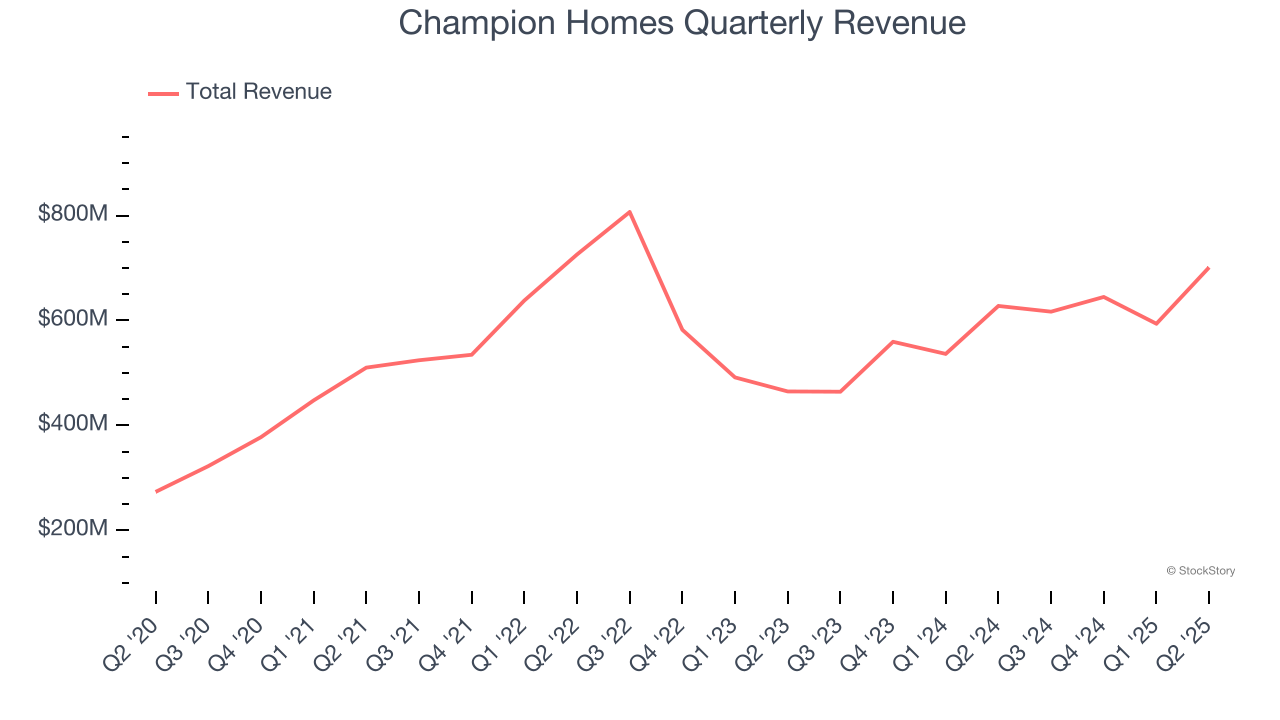
Long-term growth is the most important, but within industrials, a half-decade historical view may miss new industry trends or demand cycles. Champion Homes’s recent performance shows its demand has slowed significantly as its annualized revenue growth of 4.4% over the last two years was well below its five-year trend. 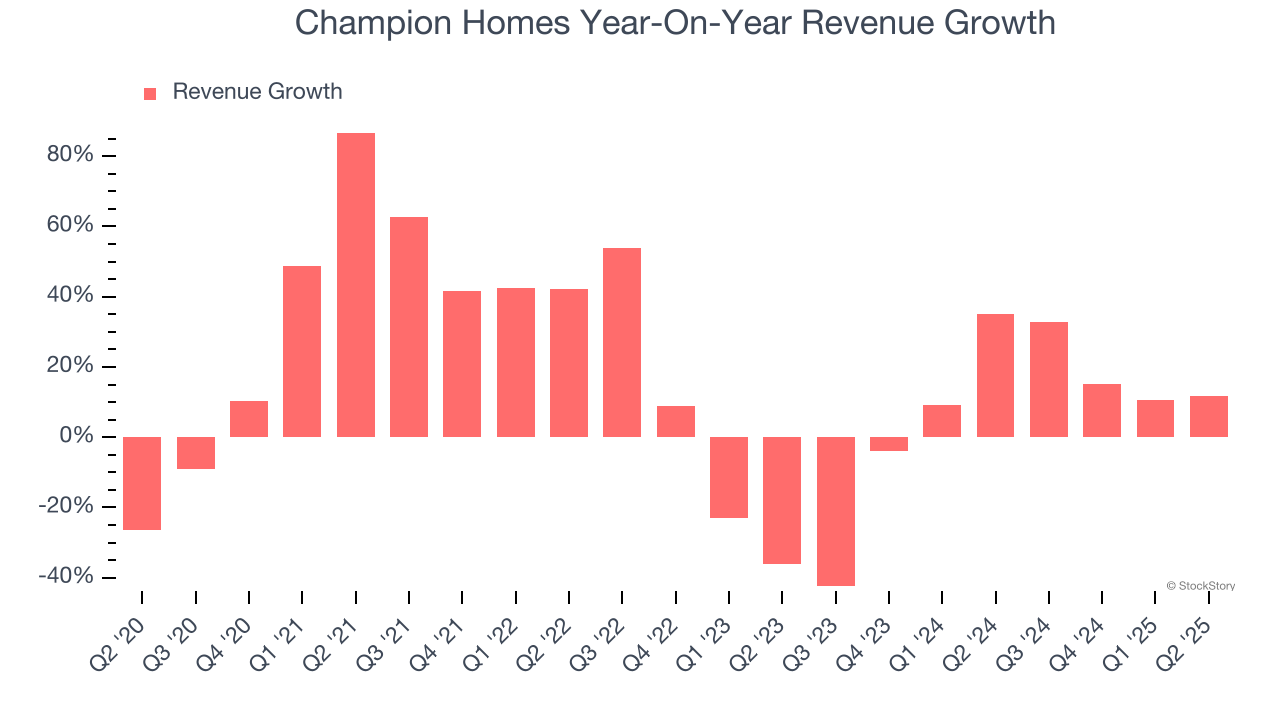
We can better understand the company’s revenue dynamics by analyzing its number of units sold, which reached 6,965 in the latest quarter. Over the last two years, Champion Homes’s units sold averaged 9.1% year-on-year growth. Because this number is better than its revenue growth, we can see the company’s average selling price decreased. 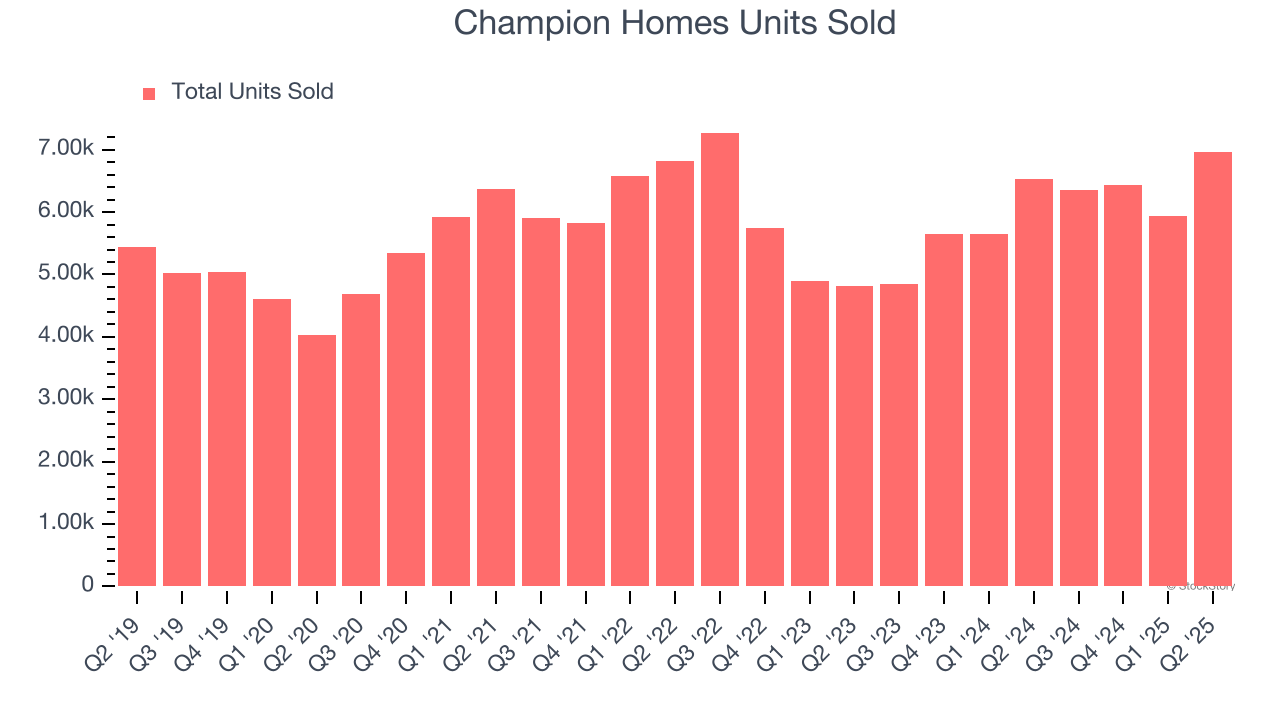
This quarter, Champion Homes reported year-on-year revenue growth of 11.7%, and its $701.3 million of revenue exceeded Wall Street’s estimates by 9.5%.
Looking ahead, sell-side analysts expect revenue to grow 4.2% over the next 12 months, similar to its two-year rate. This projection is underwhelming and suggests its newer products and services will not lead to better top-line performance yet.
Unless you’ve been living under a rock, it should be obvious by now that generative AI is going to have a huge impact on how large corporations do business. While Nvidia and AMD are trading close to all-time highs, we prefer a lesser-known (but still profitable) stock benefiting from the rise of AI. Click here to access our free report one of our favorites growth stories.
Operating Margin
Champion Homes’s operating margin has risen over the last 12 months and averaged 12.9% over the last five years. On top of that, its profitability was top-notch for an industrials business, showing it’s an well-run company with an efficient cost structure. This result was particularly impressive because of its low gross margin, which is mostly a factor of what it sells and takes huge shifts to move meaningfully. Companies have more control over their operating margins, and it’s a show of well-managed operations if they’re high when gross margins are low.
Analyzing the trend in its profitability, Champion Homes’s operating margin might fluctuated slightly but has generally stayed the same over the last five years. This raises questions about the company’s expense base because its revenue growth should have given it leverage on its fixed costs, resulting in better economies of scale and profitability.
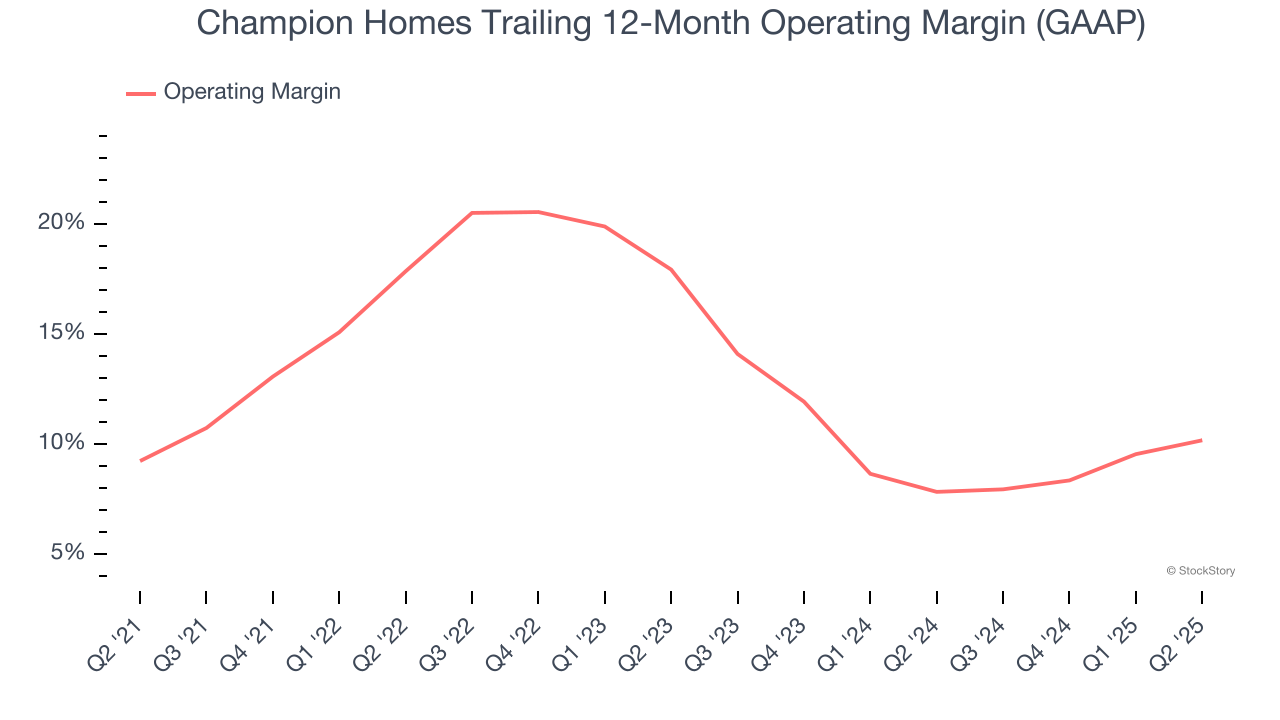
In Q2, Champion Homes generated an operating margin profit margin of 11.2%, up 2.4 percentage points year on year. The increase was encouraging, and because its operating margin rose more than its gross margin, we can infer it was more efficient with expenses such as marketing, R&D, and administrative overhead.
Earnings Per Share
Revenue trends explain a company’s historical growth, but the long-term change in earnings per share (EPS) points to the profitability of that growth – for example, a company could inflate its sales through excessive spending on advertising and promotions.
Champion Homes’s EPS grew at an astounding 30.2% compounded annual growth rate over the last five years, higher than its 15% annualized revenue growth. This tells us the company became more profitable on a per-share basis as it expanded.
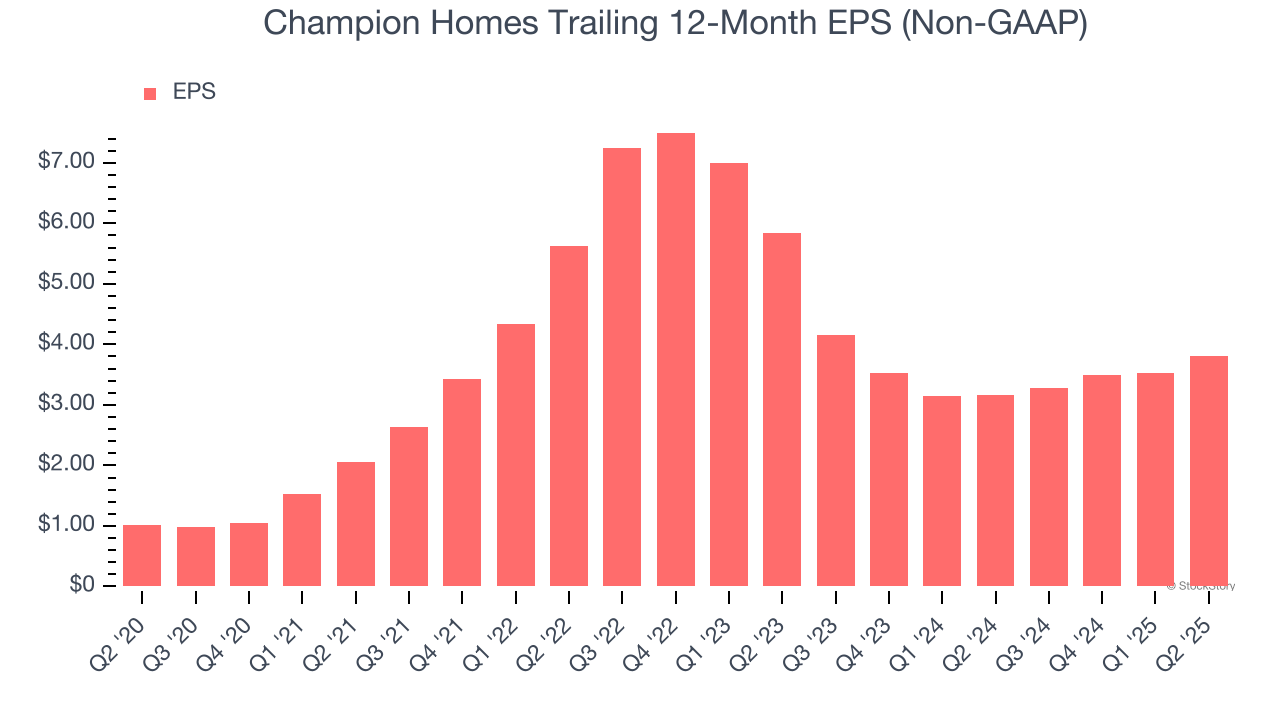
Like with revenue, we analyze EPS over a shorter period to see if we are missing a change in the business.
For Champion Homes, its two-year annual EPS declines of 19.2% mark a reversal from its (seemingly) healthy five-year trend. We hope Champion Homes can return to earnings growth in the future.
In Q2, Champion Homes reported adjusted EPS at $1.19, up from $0.91 in the same quarter last year. This print easily cleared analysts’ estimates, and shareholders should be content with the results. Over the next 12 months, Wall Street expects Champion Homes’s full-year EPS of $3.81 to shrink by 12%.
Key Takeaways from Champion Homes’s Q2 Results
We were impressed by how significantly Champion Homes blew past analysts’ sales volume expectations this quarter. We were also excited its EPS outperformed Wall Street’s estimates by a wide margin. Zooming out, we think this was a solid print. The stock traded up 13.5% to $75.10 immediately following the results.
Indeed, Champion Homes had a rock-solid quarterly earnings result, but is this stock a good investment here? The latest quarter does matter, but not nearly as much as longer-term fundamentals and valuation, when deciding if the stock is a buy. We cover that in our actionable full research report which you can read here, it’s free.


