
- Year-over-year home price slowed for the ninth straight month in January but posted positive gains for the 132nd straight month
- Three Northwestern states — Idaho, Washington and Montana — plus Washington, D.C., saw year-over-year home price declines in January
CoreLogic®, a leading global property information, analytics and data-enabled solutions provider, today released the CoreLogic Home Price Index (HPI™) and HPI Forecast™ for January 2023.
This press release features multimedia. View the full release here: https://www.businesswire.com/news/home/20230307005295/en/
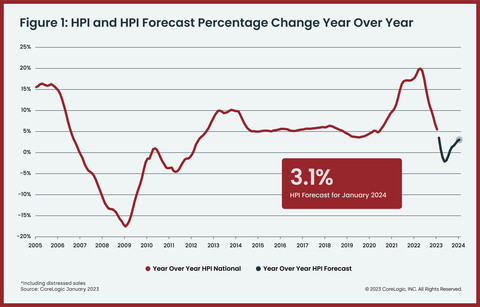
Figure 1: HPI & HPI Forecast % Change YOY (Graphic: Business Wire)
U.S. home prices continued their gradual free fall in January, with the 5.5% annual gain down for the ninth straight month and the lowest recorded since June 2020. Deceleration was particularly noticeable in the Western U.S. and other states and metro areas that saw substantial appreciation over the past few years. Three Northwestern states (along with Washington, D.C.) posted at least slight annual declines as migration patterns that began during the pandemic shifted, slowing demand and driving price decreases.
"While 2023 kicked off on a more optimistic note for the U.S. housing market, recent mortgage rate volatility highlights how much uncertainty remains," said Selma Hepp, chief economist at CoreLogic. "Nevertheless, the continued shortage of for-sale homes is likely to keep price declines modest, which are projected to top out at 3% peak to trough."
"Home price depreciation and strong income growth are expected to boost affordability, which is particularly important for first-time buyers," Hepp continued. "This group has accounted for a higher share of mortgage applications since last summer, as first-time buyers don't need to surrender an extremely low mortgage rate like current homeowners."
Top Takeaways:
- U.S. home prices (including distressed sales) increased by 5.5% year over year in January 2023 compared to January 2022. On a month-over-month basis, home prices declined by 0.2% compared to December 2022.
- In January, the annual appreciation of attached properties (6.5%) was 1.3 percentage points higher than that of detached properties (5.2%).
- CoreLogic forecasts show annual U.S. home price gains slowing to 3.1% by January 2024.
- Miami posted the highest year-over-year home price increase of the country's 20 largest metro areas in January, at 17.3%, while Tampa, Florida continued to rank second at 11.7%.
- Florida and Maine recorded the highest annual home price gains, 13.4% and 11.5%, respectively. South Carolina posted the third-highest gain, with a 10.7% year-over-year increase. Three states and one district registered year-over-year price declines: Idaho (-2.3%), Washington (-2.2%), Montana (-0.6%) and Washington, D.C. (-0.1%).
The next CoreLogic HPI press release, featuring February 2023 data, will be issued on April 4, 2023, at 8 a.m. ET.
Methodology
The CoreLogic HPI™ is built on industry-leading public record, servicing and securities real-estate databases and incorporates more than 45 years of repeat-sales transactions for analyzing home price trends. Generally released on the first Tuesday of each month with an average five-week lag, the CoreLogic HPI is designed to provide an early indication of home price trends by market segment and for the Single-Family Combined tier, representing the most comprehensive set of properties, including all sales for single-family attached and single-family detached properties. The indices are fully revised with each release and employ techniques to signal turning points sooner. The CoreLogic HPI provides measures for multiple market segments, referred to as tiers, based on property type, price, time between sales, loan type (conforming vs. non-conforming) and distressed sales. Broad national coverage is available from the national level down to ZIP Code, including non-disclosure states.
CoreLogic HPI Forecasts™ are based on a two-stage, error-correction econometric model that combines the equilibrium home price—as a function of real disposable income per capita—with short-run fluctuations caused by market momentum, mean-reversion, and exogenous economic shocks like changes in the unemployment rate. With a 30-year forecast horizon, CoreLogic HPI Forecasts project CoreLogic HPI levels for two tiers — Single-Family Combined (both attached and detached) and Single-Family Combined Excluding Distressed Sales. As a companion to the CoreLogic HPI Forecasts, Stress-Testing Scenarios align with Comprehensive Capital Analysis and Review (CCAR) national scenarios to project five years of home prices under baseline, adverse and severely adverse scenarios at state, metropolitan areas and ZIP Code levels. The forecast accuracy represents a 95% statistical confidence interval with a +/- 2% margin of error for the index.
About Market Risk Indicators
Market Risk Indicators are a subscription-based analytics solution that provide monthly updates on the overall health of housing markets across the country. CoreLogic data scientists combine world-class analytics with detailed economic and housing data to help determine the likelihood of a housing bubble burst in 392 major metros and all 50 states. Market Risk Indicators is a multi-phase regression model that provides a probability score (from 1 to 100) on the likelihood of two scenarios per metro: a >10% price reduction and a ≤ 10% price reduction. The higher the score, the higher the risk of a price reduction.
About the Market Condition Indicators
As part of the CoreLogic HPI and HPI Forecasts offerings, Market Condition Indicators are available for all metropolitan areas and identify individual markets as overvalued, at value or undervalued. These indicators are derived from the long-term fundamental values, which are a function of real disposable income per capita. Markets are labeled as overvalued if the current home price indexes exceed their long-term values by greater than 10% and undervalued where the long-term values exceed the index levels by greater than 10%.
Source: CoreLogic
The data provided are for use only by the primary recipient or the primary recipient's publication or broadcast. This data may not be resold, republished or licensed to any other source, including publications and sources owned by the primary recipient's parent company without prior written permission from CoreLogic. Any CoreLogic data used for publication or broadcast, in whole or in part, must be sourced as coming from CoreLogic, a data and analytics company. For use with broadcast or web content, the citation must directly accompany first reference of the data. If the data are illustrated with maps, charts, graphs or other visual elements, the CoreLogic logo must be included on screen or website. For questions, analysis or interpretation of the data, contact Robin Wachner at newsmedia@corelogic.com. For sales inquiries, visit https://www.corelogic.com/support/sales-contact/. Data provided may not be modified without the prior written permission of CoreLogic. Do not use the data in any unlawful manner. The data are compiled from public records, contributory databases and proprietary analytics, and its accuracy is dependent upon these sources.
About CoreLogic
CoreLogic is a leading global property information, analytics and data-enabled solutions provider. The company's combined data from public, contributory and proprietary sources includes over 4.5 billion records spanning more than 50 years, providing detailed coverage of property, mortgages and other encumbrances, consumer credit, tenancy, location, hazard risk and related performance information. The markets CoreLogic serves include real estate and mortgage finance, insurance, capital markets, and the public sector. CoreLogic delivers value to clients through unique data, analytics, workflow technology, advisory and managed services. Clients rely on CoreLogic to help identify and manage growth opportunities, improve performance and mitigate risk. Headquartered in Irvine, Calif., CoreLogic operates in North America, Western Europe and Asia Pacific. For more information, please visit www.corelogic.com.
CORELOGIC, the CoreLogic logo, CoreLogic HPI and CoreLogic HPI Forecast are trademarks of CoreLogic, Inc. and/or its subsidiaries. All other trademarks are the property of their respective owners.
View source version on businesswire.com: https://www.businesswire.com/news/home/20230307005295/en/
Contacts
Media Contact:
Robin Wachner
newsmedia@corelogic.com
Sales Contact:
https://www.corelogic.com/support/sales-contact/


