
- Homeowners with mortgages gained a collective $3.6 trillion year over year in the second quarter of 2022.
- Borrowers in Hawaii, California and Florida gained at least $100,000 in equity since the second quarter of 2021.
CoreLogic, a leading global property information, analytics and data-enabled solutions provider, today released the Homeowner Equity Report (HER) for the second quarter of 2022. The report shows U.S. homeowners with mortgages (which account for roughly 63% of all properties) saw equity increase by 27.8% year over year, representing a collective gain of $3.6 trillion, for an average of $60,200 per borrower, since the second quarter of 2021.
This press release features multimedia. View the full release here: https://www.businesswire.com/news/home/20220909005071/en/
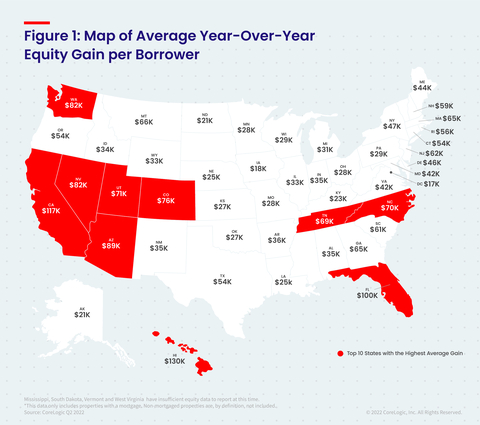
Figure 1: Map of Average Year-Over-Year Equity Gain per Borrower (Graphic: Business Wire)
Although U.S. home price growth slowed on an annual basis in the second quarter of 2022, homeowners continued to gain near-record equity from the second quarter of 2021, with 15 states posting higher gains than the national average, led by Hawaii, California and Florida. The total average equity per borrower has now reached almost $300,000, the highest in the data series. Home price growth and the refinance boom of the last two years have helped bring down the national average loan-to-value ratio to 42%, the lowest in the data series since 2010.
“For many households, home equity is the only source of wealth creation,” said Selma Hepp, interim lead of the Office of the Chief Economist for CoreLogic. “As a result, recent record gains in equity and record declines in loan-to-value ratios will provide many owners with a financial buffer in case economic conditions worsen. In addition, record equity continues to provide fuel for housing demand, particularly if households are relocating to more affordable areas.”
Negative equity, also referred to as underwater or upside-down mortgages, applies to borrowers who owe more on their mortgages than their homes are currently worth. As of the second quarter of 2022, the quarterly and annual changes in negative equity were:
- Quarterly change: From the first quarter of 2022 to the second quarter of 2022, the total number of mortgaged homes in negative equity decreased by 7% to 1 million homes, or 1.8% of all mortgaged properties.
- Annual change: In the second quarter of 2021, 1.3 million homes, or 2.3% of all mortgaged properties, were in negative equity. This number declined by 18% in the second quarter of 2022.
Because home equity is affected by home price changes, borrowers with equity positions near (+/- 5%) the negative equity cutoff are most likely to move out of or into negative equity as prices change, respectively. Looking at the second quarter of 2022 book of mortgages, if home prices increase by 5%, 116,000 homes would regain equity; if home prices decline by 5%, 148,000 properties would fall underwater.
The next CoreLogic Homeowner Equity Report will be released in December 2022, featuring data for Q3 2022. For ongoing housing trends and data, visit the CoreLogic Intelligence Blog: www.corelogic.com/intelligence.
Methodology
The amount of equity for each property is determined by comparing the estimated current value of the property against the mortgage debt outstanding (MDO). If the MDO is greater than the estimated value, then the property is determined to be in a negative equity position. If the estimated value is greater than the MDO, then the property is determined to be in a positive equity position. The data is first generated at the property level and aggregated to higher levels of geography. CoreLogic uses public record data as the source of the MDO, which includes more than 50 million first- and second-mortgage liens, and is adjusted for amortization and home equity utilization in order to capture the true level of MDO for each property. Only data for mortgaged residential properties that have a current estimated value are included. There are several states or jurisdictions where the public record, current value or mortgage data coverage is thin and have been excluded from the analysis. These instances account for fewer than 5% of the total U.S. population. The percentage of homeowners with a mortgage is from the 2019 American Community Survey. Data for the previous quarter was revised. Revisions with public records data are standard, and to ensure accuracy, CoreLogic incorporates the newly released public data to provide updated results.
Source: CoreLogic
The data provided is for use only by the primary recipient or the primary recipient's publication or broadcast. This data may not be re-sold, republished or licensed to any other source, including publications and sources owned by the primary recipient's parent company without prior written permission from CoreLogic. Any CoreLogic data used for publication or broadcast, in whole or in part, must be sourced as coming from CoreLogic, a data and analytics company. For use with broadcast or web content, the citation must directly accompany first reference of the data. If the data is illustrated with maps, charts, graphs or other visual elements, the CoreLogic logo must be included on screen or website. For questions, analysis or interpretation of the data, contact Robin Wachner at newsmedia@corelogic.com. Data provided may not be modified without the prior written permission of CoreLogic. Do not use the data in any unlawful manner. This data is compiled from public records, contributory databases and proprietary analytics, and its accuracy is dependent upon these sources.
About CoreLogic
CoreLogic is a leading global property information, analytics and data-enabled solutions provider. The company's combined data from public, contributory and proprietary sources includes over 4.5 billion records spanning more than 50 years, providing detailed coverage of property, mortgages and other encumbrances, consumer credit, tenancy, location, hazard risk and related performance information. The markets CoreLogic serves include real estate and mortgage finance, insurance, capital markets, and the public sector. CoreLogic delivers value to clients through unique data, analytics, workflow technology, advisory and managed services. Clients rely on CoreLogic to help identify and manage growth opportunities, improve performance and mitigate risk. Headquartered in Irvine, Calif., CoreLogic operates in North America, Western Europe and Asia Pacific. For more information, please visit www.corelogic.com.
CORELOGIC and the CoreLogic logo are trademarks of CoreLogic, Inc. and/or its subsidiaries. All other trademarks are the property of their respective owners.
View source version on businesswire.com: https://www.businesswire.com/news/home/20220909005071/en/
Contacts
Robin Wachner
newsmedia@corelogic.com


