
Record GAAP and Adjusted Net Revenue for Third Quarter 2022
GAAP Net Revenue of $424 Million Up 56%; $419 Million Adjusted Net Revenue Up 51% Year-over-Year
Record Adjusted EBITDA of $44 Million Up 332% Year-over-Year and Up 118% Sequentially
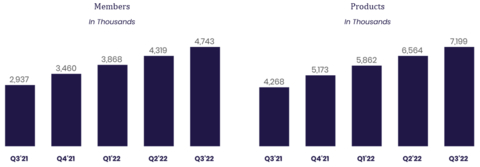
New Member Adds of Nearly 424,000; Quarter-End Total Members Up 61% Year-over-Year to Over 4.7 Million
New Product Adds of Over 635,000; Quarter-End Total Products Up 69% Year-over-Year to Nearly 7.2 Million
Management Raises Full-Year 2022 Guidance
SoFi Technologies, Inc. (NASDAQ: SOFI), a member-centric, one-stop shop for digital financial services that helps members borrow, save, spend, invest and protect their money, reported financial results today for its third quarter ended September 30, 2022.
This press release features multimedia. View the full release here: https://www.businesswire.com/news/home/20221101005542/en/
Note: For additional information on our company metrics, including the definitions of “Members”, “Total Products” and “Technology Platform Total Accounts”, see Table 5 in the “Financial Tables” herein. (Graphic: Business Wire)
“We delivered another quarter of record financial results with robust growth in members, products, and cross-buy. We generated our sixth consecutive quarter of record adjusted net revenue, which was up 51% year-over-year. We also generated record adjusted EBITDA, which more than doubled sequentially for the second consecutive quarter,” said Anthony Noto, CEO of SoFi Technologies, Inc. “Strength across all three of our business segments — Lending, Technology Platform and Financial Services — drove our record third quarter adjusted net revenue of $419 million and record adjusted EBITDA of over $44 million.”
Consolidated Results Summary
|
|
Three Months Ended September 30, |
|
% Change |
|||||||
($ in thousands) |
|
2022 |
|
2021 |
|
||||||
Consolidated – GAAP |
|
|
|
|
|
|
|||||
Total net revenue |
|
$ |
423,985 |
|
|
$ |
272,006 |
|
|
56 |
% |
Net loss |
|
|
(74,209 |
) |
|
|
(30,047 |
) |
|
n/m |
|
Loss per share – basic and diluted |
|
|
(0.09 |
) |
|
|
(0.05 |
) |
|
n/m |
|
|
|
|
|
|
|
|
|||||
Consolidated – Non-GAAP |
|
|
|
|
|
|
|||||
Adjusted net revenue(1) |
|
$ |
419,256 |
|
|
$ |
277,190 |
|
|
51 |
% |
Adjusted EBITDA(1) |
|
|
44,298 |
|
|
|
10,256 |
|
|
332 |
% |
(1) |
|
Adjusted net revenue and adjusted EBITDA are non-GAAP financial measures. For more information and reconciliations to the most comparable GAAP measures, see “Non-GAAP Financial Measures” and Table 2 to the “Financial Tables” herein. |
Noto continued: “Our strong momentum in member, product and cross-buy adds reflects the benefits of our broad product suite and unique Financial Services Productivity Loop (FSPL) strategy. We added nearly 424,000 new members, and ended with over 4.7 million total members, up 61% year-over-year. We also added over 635,000 new products, and ended with nearly 7.2 million total products, a 69% annual increase.”
Noto concluded: “Our bank charter is enabling new flexibility that has proven even more valuable in light of the current macro environment, and the economic benefits are already starting to materialize and positively impact our operating and financial results. Total deposits grew 86% during the quarter to $5.0 billion at quarter-end, and 85% of SoFi Money deposits (inclusive of Checking and Savings and SoFi Money cash management accounts) are from direct deposit members. For new direct deposit accounts opened in the third quarter, the median FICO score was 750. Half of newly funded SoFi Money accounts are setting up direct deposit by day 30 (versus 37% in the second quarter), and this has had a significant impact on debit spending.
“As a result of this growth in high quality deposits, we have benefited from a lower cost of funding for our loans. Our deposit funding also increases our flexibility to capture additional net interest margin (NIM) and optimize returns, a critical advantage in light of notable macro uncertainty. In its second full quarter of operations, SoFi Bank, N.A. generated approximately $29 million of positive GAAP net income at an 11% margin.”
Consolidated Results
Third quarter total GAAP net revenue increased 56% to $424.0 million from the prior-year period's $272.0 million. Third quarter adjusted net revenue of $419.3 million was up 51% from the same prior-year period's $277.2 million. Strength in all three of SoFi's business segments — Lending, Technology Platform and Financial Services — drove the robust year-over-year growth.
SoFi recorded a GAAP net loss of $74.2 million for the third quarter of 2022, an increase from the prior-year period's net loss of $30.0 million. The third quarter of 2021 included the benefit of $64.4 million from the change in fair value of warrant liabilities. Excluding this impact, GAAP net loss would have improved by $20.2 million year-over-year. Third quarter record adjusted EBITDA of $44.3 million increased 118% sequentially.
Member and Product Growth
SoFi achieved strong year-over-year growth in both members and products in the third quarter of 2022. New member additions of nearly 424,000 brought total members to 4.7 million by quarter-end, up over 1.8 million, or 61%, from the end of 2021's third quarter.
New product additions of over 635,000 in the third quarter brought total products to nearly 7.2 million at quarter-end, up 69% from 4.3 million at the same prior year quarter-end.
In the Financial Services segment, total products increased by 83% year-over-year, to 5.9 million from 3.2 million in the third quarter of 2021. SoFi Money (inclusive of SoFi Money cash management accounts and SoFi Checking and Savings accounts) grew 72% year-over-year to 2.0 million products, SoFi Invest grew 68% during the period to approximately 2.1 million products, and SoFi Relay grew 113% year-over year to 1.6 million products.
Lending products rose 24% year over year, up from the second quarter’s 22% year-over-year growth and resulting in the sixth straight quarter of accelerating year-over-year growth, driven primarily by continued record demand for personal loans.
Technology Platform enabled accounts increased by 40% year over year to 124.3 million, due to both diverse new client additions and growth among existing clients.
Lending Segment Results
Lending segment GAAP and adjusted net revenues were $301.7 million and $297.0 million, respectively, for the third quarter of 2022, up 43% and 38%, respectively. Higher loan balances and net interest margin expansion drove strong growth in net interest income, and record personal loan originations and strong sales execution drove growth in noninterest income.
Lending segment third quarter contribution profit of $180.6 million increased 53% from $117.7 million in the same prior-year period. Contribution margin using Lending adjusted net revenue increased to 61% from 55% in the same prior-year period. These advances reflect SoFi’s ability to capitalize on continued strong demand for its Lending products, while improving upon the member experience and realizing new efficiencies, at high credit underwriting standards.
Lending – Segment Results of Operations |
|||||||||||
|
|
Three Months Ended September 30, |
|
|
|||||||
($ in thousands) |
|
2022 |
|
2021 |
|
% Change |
|||||
Total net revenue – Lending |
|
$ |
301,694 |
|
|
$ |
210,291 |
|
|
43 |
% |
Servicing rights – change in valuation inputs or assumptions |
|
|
(6,182 |
) |
|
|
(409 |
) |
|
n/m |
|
Residual interests classified as debt – change in valuation inputs or assumptions |
|
|
1,453 |
|
|
|
5,593 |
|
|
(74 |
)% |
Directly attributable expenses |
|
|
(116,403 |
) |
|
|
(97,807 |
) |
|
19 |
% |
Contribution Profit |
|
$ |
180,562 |
|
|
$ |
117,668 |
|
|
53 |
% |
|
|
|
|
|
|
|
|||||
Adjusted net revenue – Lending(1) |
|
$ |
296,965 |
|
|
$ |
215,475 |
|
|
38 |
% |
(1) |
|
Adjusted net revenue – Lending represents a non-GAAP financial measure. For more information and a reconciliation to the most comparable GAAP measure, see “Non-GAAP Financial Measures” and Table 2 to the “Financial Tables” herein. |
Third quarter Lending segment total origination volume increased 2% year-over-year, as a result of continued strong demand for personal loans.
Record personal loan originations of over $2.8 billion in the third quarter of 2022 were up nearly $1.2 billion, or 71%, year-over-year, and rose 14% sequentially. This strong performance was aided by years of investment in technology to automate and accelerate the application-to-approval process for qualified borrowers and constant testing of risk controls and underwriting models to maintain the highest credit quality. Third quarter student loan volume of over $457 million was down more than 50% from the average pre-pandemic volume as the moratorium on student loan payments continues to weigh on the business.
Lending – Originations and Average Balances |
|||||||||||
|
|
Three Months Ended September 30, |
|
% Change |
|||||||
|
|
2022 |
|
2021 |
|
||||||
Origination volume ($ in thousands, during period) |
|
|
|
|
|
|
|||||
Home loans |
|
$ |
216,246 |
|
$ |
793,086 |
|
(73 |
)% |
||
Personal loans |
|
|
2,809,759 |
|
|
|
1,640,572 |
|
|
71 |
% |
Student loans |
|
|
457,184 |
|
|
|
967,939 |
|
|
(53 |
)% |
Total |
|
$ |
3,483,189 |
|
|
$ |
3,401,597 |
|
|
2 |
% |
|
|
|
|
|
|
|
|||||
Average loan balance ($, as of period end)(1) |
|
|
|
|
|
|
|||||
Home loans |
|
$ |
286,855 |
|
|
$ |
286,522 |
|
|
— |
% |
Personal loans |
|
|
24,772 |
|
|
|
22,207 |
|
|
12 |
% |
Student loans |
|
|
47,152 |
|
|
|
49,723 |
|
|
(5 |
)% |
(1) |
|
Within each loan product category, average loan balance is defined as the total unpaid principal balance of the loans divided by the number of loans that have a balance greater than zero dollars as of the reporting date. Average loan balance includes loans on the balance sheet and transferred loans with which SoFi has a continuing involvement through its servicing agreements. |
|
|
September 30, |
|
|
|||||||
Lending – Products |
|
2022 |
|
2021 |
|
% Change |
|||||
Home loans |
25,707 |
|
21,318 |
|
21 |
% |
|||||
Personal loans |
|
|
783,645 |
|
|
|
578,772 |
|
|
35 |
% |
Student loans |
|
|
471,141 |
|
|
|
430,792 |
|
|
9 |
% |
Total lending products |
|
|
1,280,493 |
|
|
|
1,030,882 |
|
|
24 |
% |
Technology Platform Segment Results
Technology Platform segment net revenue of $84.8 million for the third quarter of 2022 increased 69% year-over-year, and includes record Galileo revenues, which were up 29% year-over-year, and continued strong contribution from Technisys. Contribution profit of $19.5 million increased 24% year over year, for a margin of 23%. Excluding Technisys, contribution margin was 30% versus 31% for the same prior-year period. As previously stated, Management intends to continue investing heavily in the Technology Platform segment to capture its significant and accelerating secular growth opportunities across client verticals, products and geographies. We continue to anticipate operating this business in the 20–30% contribution margin range for the foreseeable future as a result of these investments.
Technology Platform – Segment Results of Operations |
|||||||||||
|
|
Three Months Ended September 30, |
|
|
|||||||
($ in thousands) |
|
2022 |
|
2021 |
|
% Change |
|||||
Total net revenue |
|
$ |
84,777 |
|
|
$ |
50,225 |
|
|
69 |
% |
Directly attributable expenses |
|
|
(65,241 |
) |
|
|
(34,484 |
) |
|
89 |
% |
Contribution Profit |
|
$ |
19,536 |
|
|
$ |
15,741 |
|
|
24 |
% |
Technology Platform total enabled client accounts increased 40% year over year, to 124.3 million from 88.8 million, through new client acquisition and growth at existing clients.
|
|
September 30, |
|
|
|||||||
Technology Platform |
|
2022 |
|
2021 |
|
% Change |
|||||
Total accounts |
|
124,332,810 |
|
88,811,022 |
|
40 |
% |
||||
Financial Services Segment Results
Financial Services segment net revenue increased 288% in the third quarter of 2022 to $49.0 million from the prior year period's total of $12.6 million.
The Financial Services segment contribution loss of $52.6 million was $13.2 million larger than the prior-year quarter's $39.5 million loss, largely due to the credit card business, where SoFi is building current expected credit loss (CECL) reserves. The absolute amount of reserves is expected to increase as the business continues to grow and scale.
Financial Services – Segment Results of Operations |
|||||||||||
|
|
Three Months Ended September 30, |
|
|
|||||||
($ in thousands) |
|
2022 |
|
2021 |
|
% Change |
|||||
Total net revenue |
|
$ |
48,953 |
|
|
$ |
12,620 |
|
|
288 |
% |
Directly attributable expenses |
|
|
(101,576 |
) |
|
|
(52,085 |
) |
|
95 |
% |
Contribution loss |
|
$ |
(52,623 |
) |
|
$ |
(39,465 |
) |
|
33 |
% |
By continuously innovating for members with new and relevant offerings, features and rewards, SoFi grew total Financial Services products by approximately 2.7 million, or 83%, year-over-year in the third quarter of 2022, bringing the total to approximately 5.9 million. In the third quarter, SoFi Money added nearly 166,000 products, SoFi Invest products increased by over 106,000 and Relay products increased by nearly 256,000.
Most notably, upon securing a bank charter in the first quarter of 2022, SoFi launched a new Checking and Savings offering, which today has an APY of up to 2.50%, no minimum balance requirement, a host of free features and a unique rewards program. Total deposits grew 86% during the quarter to $5.0 billion at quarter-end, and 85% of SoFi Money deposits (inclusive of Checking and Savings and SoFi Money cash management accounts) are from direct deposit members. Half of newly funded SoFi Money accounts are setting up direct deposit by day 30 (versus 37% in the second quarter), and this has had a significant impact on debit spending.
|
|
September 30, |
|
|
|||||||
Financial Services – Products |
|
2022 |
|
2021 |
|
% Change |
|||||
SoFi Money(1) |
|
$ |
2,002,791 |
) |
|
$ |
1,161,322 |
) |
|
72 |
% |
Invest |
|
|
2,067,621 |
|
|
|
1,233,527 |
|
|
68 |
% |
Credit Card |
|
|
153,978 |
|
|
|
65,595 |
|
|
135 |
% |
Referred loans |
|
|
36,538 |
|
|
|
— |
|
|
n/m |
|
Relay |
|
|
1,600,102 |
|
|
|
749,972 |
|
|
113 |
% |
At Work |
|
|
57,775 |
|
|
|
26,367 |
|
|
119 |
% |
Total financial services products |
|
|
5,918,805 |
|
|
|
3,236,783 |
|
|
83 |
% |
(1) |
|
This product category includes SoFi Checking and Savings accounts held at SoFi Bank, which began operating in the first quarter of 2022, and SoFi Money cash management accounts. |
Guidance and Outlook
Management now expects full-year 2022 adjusted net revenue of $1.517-1.522 billion (up from $1.508-1.513 billion previously) and full-year adjusted EBITDA of $115-120 million (up from $104-109 million previously). This marks the third quarter of a positive revision to full-year 2022 financial guidance despite extensions of the student loan moratorium throughout the year. Management will further address full-year 2022 guidance on the quarterly earnings conference call.
Earnings Webcast
SoFi’s executive management team will host a live audio webcast beginning at 8:00 a.m. Eastern Time (5:00 a.m. Pacific Time) today to discuss the quarter’s financial results and business highlights. All interested parties are invited to listen to the live webcast at https://investors.sofi.com. A replay of the webcast will be available on the SoFi Investor Relations website for 30 days. Investor information, including supplemental financial information, is available on SoFi’s Investor Relations website at https://investors.sofi.com.
Cautionary Statement Regarding Forward-Looking Statements
Certain of the statements above are forward-looking and as such are not historical facts. This includes, without limitation, statements regarding our expectations for full year adjusted net revenue and adjusted EBITDA, our expectations regarding our ability to continue to grow our business, our ability to navigate the macroeconomic environment and the financial position, business strategy and plans and objectives of management for our future operations. These forward-looking statements are not guarantees of performance. Such statements can be identified by the fact that they do not relate strictly to historical or current facts. Words such as “anticipate”, “believe”, “continue”, “could”, “expect”, “intend”, “may”, “future”, “strategy”, “might”, “plan”, “should”, “would”, “will be”, “will continue”, “will likely result” and similar expressions may identify forward-looking statements, but the absence of these words does not mean that a statement is not forward-looking. Factors that could cause actual results to differ materially from those contemplated by these forward-looking statements include: (i) the effect of and uncertainties related to macroeconomic factors such as inflation and rising interest rates and any resurgence of the COVID-19 pandemic; (ii) our ability to achieve profitability and continued growth across our business in the future; (iii) the impact on our business of the regulatory environment and complexities with compliance related to such environment, including any further extension of the student loan payment moratorium or loan forgiveness, and our expectations regarding the return to pre-pandemic student loan demand levels; (iv) our ability to realize the benefits of being a bank holding company and operating SoFi Bank; (v) our ability to respond and adapt to changing market and economic conditions, including inflationary pressures and rising interest rates; (vi) our ability to continue to drive brand awareness and realize the benefits or our integrated multi-media marketing and advertising campaigns; (vii) our ability to vertically integrate our businesses and accelerate the pace of innovation of our financial products; (viii) our ability to manage our growth effectively and our expectations regarding the development and expansion of our business; (ix) our ability to access sources of capital on acceptable terms or at all, including debt financing and other sources of capital to finance operations and growth; (x) the success of our continued investments in our Financial Services segment and in our business generally; (xi) the success of our marketing efforts and our ability to expand our member base; (xii) our ability to maintain our leadership position in certain categories of our business and to grow market share in existing markets or any new markets we may enter; (xiii) our ability to develop new products, features and functionality that are competitive and meet market needs; (xiv) our ability to realize the benefits of our strategy, including what we refer to as our FSPL; (xv) our ability to make accurate credit and pricing decisions or effectively forecast our loss rates; (xvi) our ability to establish and maintain an effective system of internal controls over financial reporting; (xvii) our expectations with respect to our anticipated investment levels in our Technology Platform segment and our expected margins in that segment, including our ability to realize the benefits of the Technisys acquisition; and (xviii) the outcome of any legal or governmental proceedings that may be instituted against us. The foregoing list of factors is not exhaustive. You should carefully consider the foregoing factors and the other risks and uncertainties set forth in the section titled “Risk Factors” in our last quarterly report on Form 10-Q, as filed with the Securities and Exchange Commission, and those that are included in any of our future filings with the Securities and Exchange Commission, including our annual report on Form 10-K, under the Exchange Act.
These forward-looking statements are based on information available as of the date hereof and current expectations, forecasts and assumptions, and involve a number of judgments, risks and uncertainties. Accordingly, forward-looking statements should not be relied upon as representing our views as of any subsequent date, and we do not undertake any obligation to update forward-looking statements to reflect events or circumstances after the date they were made, whether as a result of new information, future events or otherwise, except as may be required under applicable securities laws.
As a result of a number of known and unknown risks and uncertainties, our actual results or performance may be materially different from those expressed or implied by these forward-looking statements. You should not place undue reliance on these forward-looking statements.
Non-GAAP Financial Measures
This press release presents information about our adjusted net revenue and adjusted EBITDA, which are non-GAAP financial measures provided as supplements to the results provided in accordance with accounting principles generally accepted in the United States (GAAP). We use adjusted net revenue and adjusted EBITDA to evaluate our operating performance, formulate business plans, help better assess our overall liquidity position, and make strategic decisions, including those relating to operating expenses and the allocation of internal resources. Accordingly, we believe that adjusted net revenue and adjusted EBITDA provide useful information to investors and others in understanding and evaluating our operating results in the same manner as our management. These non-GAAP measures are presented for supplemental informational purposes only, have limitations as analytical tools, and should not be considered in isolation from, or as a substitute for, the analysis of other GAAP financial measures, such as total net revenue and net income (loss). Other companies may not use these non-GAAP measures or may use similar measures that are defined in a different manner. Therefore, SoFi's non-GAAP measures may not be directly comparable to similarly titled measures of other companies. Reconciliations of these non-GAAP measures to the most directly comparable GAAP financial measures are provided in Table 2 to the “Financial Tables” herein.
Forward-looking non-GAAP financial measures are presented without reconciliations of such forward-looking non-GAAP measures because the GAAP financial measures are not accessible on a forward-looking basis and reconciling information is not available without unreasonable effort due to the inherent difficulty in forecasting and quantifying certain amounts that are necessary for such reconciliations, including adjustments reflected in our reconciliation of historic non-GAAP financial measures, the amounts of which, based on historical experience, could be material.
About SoFi
SoFi's mission is to help our members achieve financial independence to realize their ambitions. Our products for borrowing, saving, spending, investing and protecting give our over 4.5 million members fast access to tools to get their money right. SoFi membership comes with the key essentials for getting ahead, including career advisors and connection to a thriving community of like-minded, ambitious people. SoFi is also the naming rights partner of SoFi Stadium, home of the Los Angeles Chargers and the Los Angeles Rams. For more information, visit https://www.sofi.com or download our iOS and Android apps.
Availability of Other Information About SoFi
Investors and others should note that we communicate with our investors and the public using our website (www.sofi.com), the investor relations website (https://investors.sofi.com), and on social media (Twitter and LinkedIn), including but not limited to investor presentations and investor fact sheets, Securities and Exchange Commission filings, press releases, public conference calls and webcasts. The information that SoFi posts on these channels and websites could be deemed to be material information. As a result, SoFi encourages investors, the media, and others interested in SoFi to review the information that is posted on these channels, including the investor relations website, on a regular basis. This list of channels may be updated from time to time on SoFi’s investor relations website and may include additional social media channels. The contents of SoFi’s website or these channels, or any other website that may be accessed from its website or these channels, shall not be deemed incorporated by reference in any filing under the Securities Act of 1933, as amended.
FINANCIAL TABLES
- Unaudited Condensed Consolidated Statements of Operations and Comprehensive Loss
- Reconciliation of GAAP to Non-GAAP Financial Measures
- Unaudited Condensed Consolidated Balance Sheets
- Unaudited Condensed Consolidated Statements of Cash Flows
- Company Metrics
- Segment Financials
Table 1 |
|||||||||||||||
SoFi Technologies, Inc. Unaudited Condensed Consolidated Statements of Operations and Comprehensive Loss (In Thousands, Except for Share and Per Share Data) |
|||||||||||||||
|
Three Months Ended September 30, |
|
Nine Months Ended September 30, |
||||||||||||
|
2022 |
|
2021 |
|
2022 |
|
2021 |
||||||||
Interest income |
|
|
|
|
|
|
|
||||||||
Loans |
$ |
191,525 |
|
|
$ |
89,844 |
|
|
$ |
451,247 |
|
|
$ |
246,743 |
|
Securitizations |
|
2,633 |
|
|
|
2,999 |
|
|
|
7,958 |
|
|
|
11,260 |
|
Related party notes |
|
— |
|
|
|
— |
|
|
|
— |
|
|
|
211 |
|
Other |
|
3,881 |
|
|
|
758 |
|
|
|
6,758 |
|
|
|
2,023 |
|
Total interest income |
|
198,039 |
|
|
|
93,601 |
|
|
|
465,963 |
|
|
|
260,237 |
|
Interest expense |
|
|
|
|
|
|
|
||||||||
Securitizations and warehouses |
|
20,653 |
|
|
|
19,360 |
|
|
|
59,158 |
|
|
|
75,418 |
|
Deposits |
|
14,149 |
|
|
|
— |
|
|
|
19,123 |
|
|
|
— |
|
Corporate borrowings |
|
5,270 |
|
|
|
1,366 |
|
|
|
11,369 |
|
|
|
7,752 |
|
Other |
|
117 |
|
|
|
500 |
|
|
|
801 |
|
|
|
1,400 |
|
Total interest expense |
|
40,189 |
|
|
|
21,226 |
|
|
|
90,451 |
|
|
|
84,570 |
|
Net interest income |
|
157,850 |
|
|
|
72,375 |
|
|
|
375,512 |
|
|
|
175,667 |
|
Noninterest income |
|
|
|
|
|
|
|
||||||||
Loan origination and sales |
|
163,697 |
|
|
|
142,147 |
|
|
|
465,815 |
|
|
|
362,211 |
|
Securitizations |
|
(8,772 |
) |
|
|
(4,551 |
) |
|
|
(31,790 |
) |
|
|
(6,613 |
) |
Servicing |
|
7,296 |
|
|
|
458 |
|
|
|
30,003 |
|
|
|
(11,875 |
) |
Technology products and solutions |
|
82,035 |
|
|
|
49,951 |
|
|
|
223,562 |
|
|
|
140,560 |
|
Other |
|
21,879 |
|
|
|
11,626 |
|
|
|
53,754 |
|
|
|
39,314 |
|
Total noninterest income |
|
266,135 |
|
|
|
199,631 |
|
|
|
741,344 |
|
|
|
523,597 |
|
Total net revenue |
|
423,985 |
|
|
|
272,006 |
|
|
|
1,116,856 |
|
|
|
699,264 |
|
Noninterest expense |
|
|
|
|
|
|
|
||||||||
Technology and product development |
|
110,702 |
|
|
|
74,434 |
|
|
|
291,976 |
|
|
|
209,771 |
|
Sales and marketing |
|
162,129 |
|
|
|
114,985 |
|
|
|
444,121 |
|
|
|
297,170 |
|
Cost of operations |
|
83,083 |
|
|
|
69,591 |
|
|
|
232,611 |
|
|
|
187,785 |
|
General and administrative |
|
126,199 |
|
|
|
40,461 |
|
|
|
388,533 |
|
|
|
373,374 |
|
Provision for credit losses |
|
16,323 |
|
|
|
2,401 |
|
|
|
39,387 |
|
|
|
2,887 |
|
Total noninterest expense |
|
498,436 |
|
|
|
301,872 |
|
|
|
1,396,628 |
|
|
|
1,070,987 |
|
Loss before income taxes |
|
(74,451 |
) |
|
|
(29,866 |
) |
|
|
(279,772 |
) |
|
|
(371,723 |
) |
Income tax benefit (expense) |
|
242 |
|
|
|
(181 |
) |
|
|
(629 |
) |
|
|
(1,202 |
) |
Net loss |
$ |
(74,209 |
) |
|
$ |
(30,047 |
) |
|
$ |
(280,401 |
) |
|
$ |
(372,925 |
) |
Other comprehensive loss |
|
|
|
|
|
|
|
||||||||
Unrealized losses on available-for-sale securities, net |
|
(1,914 |
) |
|
|
(150 |
) |
|
|
(8,360 |
) |
|
|
(150 |
) |
Foreign currency translation adjustments, net |
|
325 |
|
|
|
204 |
|
|
|
231 |
|
|
|
(142 |
) |
Total other comprehensive income (loss) |
|
(1,589 |
) |
|
|
54 |
|
|
|
(8,129 |
) |
|
|
(292 |
) |
Comprehensive loss |
$ |
(75,798 |
) |
|
$ |
(29,993 |
) |
|
$ |
(288,530 |
) |
|
$ |
(373,217 |
) |
Loss per share |
|
|
|
|
|
|
|
||||||||
Loss per share – basic |
$ |
(0.09 |
) |
|
$ |
(0.05 |
) |
|
$ |
(0.35 |
) |
|
$ |
(0.94 |
) |
Loss per share – diluted |
$ |
(0.09 |
) |
|
$ |
(0.05 |
) |
|
$ |
(0.35 |
) |
|
$ |
(0.94 |
) |
Weighted average common stock outstanding – basic |
|
916,762,973 |
|
|
|
800,565,830 |
|
|
|
893,455,206 |
|
|
|
429,750,486 |
|
Weighted average common stock outstanding – diluted |
|
916,762,973 |
|
|
|
800,565,830 |
|
|
|
893,455,206 |
|
|
|
429,750,486 |
|
Table 2
Non-GAAP Financial Measures
Reconciliation of Adjusted Net Revenue
Adjusted net revenue is defined as total net revenue, adjusted to exclude the fair value changes in servicing rights and residual interests classified as debt due to valuation inputs and assumptions changes, which relate only to our Lending segment. For our consolidated results and for the Lending segment, we reconcile adjusted net revenue to total net revenue, the most directly comparable GAAP measure, as presented for the periods indicated below:
|
|
Three Months Ended September 30, |
|
Nine Months Ended September 30, |
||||||||||||
($ in thousands) |
|
2022 |
|
2021 |
|
2022 |
|
2021 |
||||||||
Total net revenue |
|
$ |
423,985 |
|
|
$ |
272,006 |
|
|
$ |
1,116,856 |
|
|
$ |
699,264 |
|
Servicing rights – change in valuation inputs or assumptions(1) |
|
|
(6,182 |
) |
|
|
(409 |
) |
|
|
(26,860 |
) |
|
|
11,924 |
|
Residual interests classified as debt – change in valuation inputs or assumptions(2) |
|
|
1,453 |
|
|
|
5,593 |
|
|
|
7,078 |
|
|
|
19,261 |
|
Adjusted net revenue |
|
$ |
419,256 |
|
|
$ |
277,190 |
|
|
$ |
1,097,074 |
|
|
$ |
730,449 |
|
|
|
Three Months Ended September 30, |
|
Nine Months Ended September 30, |
||||||||||||
($ in thousands) |
|
2022 |
|
2021 |
|
2022 |
|
2021 |
||||||||
Total net revenue – Lending |
|
$ |
301,694 |
|
|
$ |
210,291 |
|
|
$ |
811,800 |
|
|
$ |
524,559 |
|
Servicing rights – change in valuation inputs or assumptions(1) |
|
|
(6,182 |
) |
|
|
(409 |
) |
|
$ |
(26,860 |
) |
|
|
11,924 |
|
Residual interests classified as debt – change in valuation inputs or assumptions(2) |
|
|
1,453 |
|
|
|
5,593 |
|
|
$ |
7,078 |
|
|
|
19,261 |
|
Adjusted net revenue – Lending |
|
$ |
296,965 |
|
|
$ |
215,475 |
|
|
$ |
792,018 |
|
|
$ |
555,744 |
|
(1) |
|
Reflects changes in fair value inputs and assumptions on servicing rights, including conditional prepayment and default rates and discount rates. These assumptions are highly sensitive to market interest rate changes and are not indicative of our performance or results of operations. Moreover, these non-cash charges are unrealized during the period and, therefore, have no impact on our cash flows from operations. As such, these positive and negative changes are adjusted out of total net revenue to provide management and financial users with better visibility into the net revenue available to finance our operations and our overall performance. |
(2) |
|
Reflects changes in fair value inputs and assumptions on residual interests classified as debt, including conditional prepayment and default rates and discount rates. When third parties finance our consolidated securitization variable interest entities (“VIEs”) by purchasing residual interests, we receive proceeds at the time of the closing of the securitization and, thereafter, pass along contractual cash flows to the residual interest owner. These residual debt obligations are measured at fair value on a recurring basis, but they have no impact on our initial financing proceeds, our future obligations to the residual interest owner (because future residual interest claims are limited to contractual securitization collateral cash flows), or the general operations of our business. As such, these positive and negative non-cash changes in fair value attributable to assumption changes are adjusted out of total net revenue to provide management and financial users with better visibility into the net revenue available to finance our operations. |
Reconciliation of Adjusted EBITDA
Adjusted EBITDA is defined as net income (loss), adjusted to exclude, as applicable: (i) corporate borrowing-based interest expense (our adjusted EBITDA measure is not adjusted for warehouse or securitization-based interest expense, nor deposit interest expense and finance lease liability interest expense, as discussed further below), (ii) income tax expense (benefit), (iii) depreciation and amortization, (iv) share-based expense (inclusive of equity-based payments to non-employees), (v) impairment expense (inclusive of goodwill impairment and property, equipment and software abandonments), (vi) transaction-related expenses, (vii) fair value changes in warrant liabilities, and (viii) fair value changes in each of servicing rights and residual interests classified as debt due to valuation assumptions. We reconcile adjusted EBITDA to net loss, the most directly comparable GAAP measure, for the periods indicated below:
|
|
Three Months Ended September 30, |
|
Nine Months Ended September 30, |
||||||||||||
($ in thousands) |
|
2022 |
|
2021 |
|
2022 |
|
2021 |
||||||||
Net loss |
|
$ |
(74,209 |
) |
|
$ |
(30,047 |
) |
|
$ |
(280,401 |
) |
|
$ |
(372,925 |
) |
Non-GAAP adjustments: |
|
|
|
|
|
|
|
|
||||||||
Interest expense – corporate borrowings(1) |
|
|
5,270 |
|
|
|
1,366 |
|
|
|
11,369 |
|
|
|
7,752 |
|
Income tax expense (benefit)(2) |
|
|
(242 |
) |
|
|
181 |
|
|
|
629 |
|
|
|
1,202 |
|
Depreciation and amortization(3) |
|
|
40,253 |
|
|
|
24,075 |
|
|
|
109,007 |
|
|
|
75,041 |
|
Share-based expense |
|
|
77,855 |
|
|
|
72,681 |
|
|
|
235,018 |
|
|
|
162,289 |
|
Transaction-related expense(4) |
|
|
100 |
|
|
|
1,221 |
|
|
|
17,446 |
|
|
|
24,580 |
|
Fair value changes in warrant liabilities(5) |
|
|
— |
|
|
|
(64,405 |
) |
|
|
— |
|
|
|
96,504 |
|
Servicing rights – change in valuation inputs or assumptions(6) |
|
|
(6,182 |
) |
|
|
(409 |
) |
|
|
(26,860 |
) |
|
|
11,924 |
|
Residual interests classified as debt – change in valuation inputs or assumptions(7) |
|
|
1,453 |
|
|
|
5,593 |
|
|
|
7,078 |
|
|
|
19,261 |
|
Total adjustments |
|
|
118,507 |
|
|
|
40,303 |
|
|
|
353,687 |
|
|
|
398,553 |
|
Adjusted EBITDA |
|
$ |
44,298 |
|
|
$ |
10,256 |
|
|
$ |
73,286 |
|
|
$ |
25,628 |
|
(1) |
|
Our adjusted EBITDA measure adjusts for corporate borrowing-based interest expense, as these expenses are a function of our capital structure. Corporate borrowing-based interest expense primarily included (i) interest on our revolving credit facility, (ii) for the 2022 periods, the amortization of debt discount and debt issuance costs on our convertible notes, and (iii) for the nine-month 2021 period, interest on the seller note issued in connection with our acquisition of Galileo. Our adjusted EBITDA measure does not adjust for interest expense on warehouse facilities and securitization debt, which are recorded within interest expense—securitizations and warehouses in the unaudited condensed consolidated statements of operations and comprehensive income (loss), as these interest expenses are direct operating expenses driven by loan origination and sales activity. Additionally, our adjusted EBITDA measure does not adjust for interest expense on deposits or interest expense on our finance lease liability in connection with SoFi Stadium, which are recorded within interest expense—other, as these interest expenses are direct operating expenses. Revolving credit facility interest expense for the three- and nine-month periods increased due to higher interest rates during the 2022 periods on identical outstanding debt period over period. |
(2) |
|
Our income tax expense positions for the nine-month periods were primarily a function of SoFi Lending Corp.’s profitability, and for the 2022 period, SoFi Bank, in state jurisdictions where separate filings are required. The income tax expense in the 2022 period was partially offset by an income tax benefit at Technisys. |
(3) |
|
Depreciation and amortization expense for the three- and nine-month 2022 periods increased compared to the comparable 2021 periods primarily in connection with our recent acquisitions and growth in our software balance, partially offset by the acceleration of core banking infrastructure amortization during the nine-month 2021 period. |
(4) |
|
Transaction-related expenses in the nine-month 2022 period primarily included financial advisory and professional services costs associated with our acquisition of Technisys. Transaction-related expenses in the three-month 2021 period included costs associated with our then-exploratory acquisition of Technisys. Transaction-related expenses in the nine-month 2021 period also included the special payment to the holders of Series 1 Redeemable Preferred Stock in conjunction with the Business Combination and financial advisory and professional services costs associated with our then-pending acquisition of Golden Pacific. |
(5) |
|
Our adjusted EBITDA measure excludes the non-cash fair value changes in warrants accounted for as liabilities, which were measured at fair value through earnings. In conjunction with the Business Combination, SoFi Technologies assumed certain common stock warrants (“SoFi Technologies warrants”) that were accounted for as liabilities and measured at fair value on a recurring basis. The amount in the three-month 2021 period and a portion of the nine-month 2021 period relate to the SoFi Technologies warrants. The fair value of the SoFi Technologies warrants was based on the closing price of ticker SOFIW and, therefore, fluctuated based on market activity. In addition, a portion of the amount in the nine-month 2021 period related to changes in the fair value of Series H warrants issued by Social Finance in 2019 in connection with certain redeemable preferred stock issuances. We did not measure the Series H warrants at fair value subsequent to May 28, 2021 in conjunction with the Business Combination, as they were reclassified into permanent equity. |
(6) |
|
Reflects changes in fair value inputs and assumptions, including market servicing costs, conditional prepayment and default rates and discount rates. This non-cash change is unrealized during the period and, therefore, has no impact on our cash flows from operations. As such, these positive and negative changes in fair value attributable to assumption changes are adjusted out of net loss to provide management and financial users with better visibility into the earnings available to finance our operations. |
(7) |
|
Reflects changes in fair value inputs and assumptions, including conditional prepayment and default rates and discount rates. When third parties finance our consolidated VIEs through purchasing residual interests, we receive proceeds at the time of the securitization close and, thereafter, pass along contractual cash flows to the residual interest owner. These obligations are measured at fair value on a recurring basis, which has no impact on our initial financing proceeds, our future obligations to the residual interest owner (because future residual interest claims are limited to contractual securitization collateral cash flows), or the general operations of our business. As such, these positive and negative non-cash changes in fair value attributable to assumption changes are adjusted out of net loss to provide management and financial users with better visibility into the earnings available to finance our operations. |
Table 3 |
|||||||
SoFi Technologies, Inc. Unaudited Condensed Consolidated Balance Sheets (In Thousands, Except for Share Data) |
|||||||
|
September 30, 2022 |
|
December 31, 2021 |
||||
Assets |
|
|
|
||||
Cash and cash equivalents |
$ |
935,159 |
|
|
$ |
494,711 |
|
Restricted cash and restricted cash equivalents |
|
326,274 |
|
|
|
273,726 |
|
Investments in available-for-sale securities (amortized cost of $204,359 and $195,796, respectively) |
|
195,133 |
|
|
|
194,907 |
|
Loans, less allowance for credit losses on loans at amortized cost of $34,370 and $7,037, respectively |
|
11,204,403 |
|
|
|
6,068,884 |
|
Servicing rights |
|
168,438 |
|
|
|
168,259 |
|
Securitization investments |
|
261,672 |
|
|
|
374,688 |
|
Equity method investments |
|
— |
|
|
|
19,739 |
|
Property, equipment and software |
|
164,421 |
|
|
|
111,873 |
|
Goodwill |
|
1,622,951 |
|
|
|
898,527 |
|
Intangible assets |
|
456,771 |
|
|
|
284,579 |
|
Operating lease right-of-use assets |
|
100,411 |
|
|
|
115,191 |
|
Other assets, less allowance for credit losses of $1,791 and $2,292, respectively |
|
399,270 |
|
|
|
171,242 |
|
Total assets |
$ |
15,834,903 |
|
|
$ |
9,176,326 |
|
Liabilities, temporary equity and permanent equity |
|
|
|
||||
Liabilities: |
|
|
|
||||
Deposits: |
|
|
|
||||
Noninterest-bearing deposits |
$ |
89,761 |
|
|
$ |
— |
|
Interest-bearing deposits |
|
4,941,869 |
|
|
|
— |
|
Total deposits |
|
5,031,630 |
|
|
|
— |
|
Accounts payable, accruals and other liabilities |
|
565,910 |
|
|
|
298,164 |
|
Operating lease liabilities |
|
121,729 |
|
|
|
138,794 |
|
Debt |
|
4,568,523 |
|
|
|
3,947,983 |
|
Residual interests classified as debt |
|
45,734 |
|
|
|
93,682 |
|
Total liabilities |
|
10,333,526 |
|
|
|
4,478,623 |
|
Commitments, guarantees, concentrations and contingencies |
|
|
|
||||
Temporary equity: |
|
|
|
||||
Redeemable preferred stock, $0.00 par value: 100,000,000 shares authorized; 3,234,000 shares issued and outstanding as of September 30, 2022 and December 31, 2021 |
|
320,374 |
|
|
|
320,374 |
|
Permanent equity: |
|
|
|
||||
Common stock, $0.00 par value: 3,100,000,000 and 3,100,000,000 shares authorized; 927,345,977 and 828,154,462 shares issued and outstanding as of September 30, 2022 and December 31, 2021, respectively |
|
92 |
|
|
|
83 |
|
Additional paid-in capital |
|
6,654,026 |
|
|
|
5,561,831 |
|
Accumulated other comprehensive loss |
|
(9,600 |
) |
|
|
(1,471 |
) |
Accumulated deficit |
|
(1,463,515 |
) |
|
|
(1,183,114 |
) |
Total permanent equity |
|
5,181,003 |
|
|
|
4,377,329 |
|
Total liabilities, temporary equity and permanent equity |
$ |
15,834,903 |
|
|
$ |
9,176,326 |
|
Table 4 |
|||||||
SoFi Technologies, Inc. Unaudited Condensed Consolidated Statements of Cash Flows (In Thousands) |
|||||||
|
Nine Months Ended September 30, |
||||||
|
2022 |
|
2021 |
||||
Operating activities |
|
|
|
||||
Net loss |
$ |
(280,401 |
) |
|
$ |
(372,925 |
) |
Adjustments to reconcile net loss to net cash used in operating activities: |
|
|
|
||||
Share-based compensation expense |
|
235,018 |
|
|
|
162,289 |
|
Depreciation and amortization |
|
109,007 |
|
|
|
75,041 |
|
Deferred debt issuance and discount expense |
|
12,106 |
|
|
|
14,228 |
|
Provision for credit losses |
|
39,387 |
|
|
|
2,887 |
|
Deferred income taxes |
|
(4,420 |
) |
|
|
699 |
|
Fair value changes in residual interests classified as debt |
|
7,078 |
|
|
|
19,261 |
|
Fair value changes in securitization investments |
|
13,256 |
|
|
|
(7,106 |
) |
Fair value changes in warrant liabilities |
|
— |
|
|
|
96,504 |
|
Other |
|
11,635 |
|
|
|
(7,275 |
) |
Changes in operating assets and liabilities: |
|
|
|
||||
Originations and purchases of loans |
|
(11,635,939 |
) |
|
|
(9,375,583 |
) |
Proceeds from sales and repayments of loans |
|
6,654,289 |
|
|
|
9,297,238 |
|
Other changes in loans |
|
10,566 |
|
|
|
2,138 |
|
Servicing assets |
|
(179 |
) |
|
|
(13,877 |
) |
Related party notes receivable interest income |
|
— |
|
|
|
1,399 |
|
Other assets |
|
(36,691 |
) |
|
|
(26,883 |
) |
Accounts payable, accruals and other liabilities |
|
28,265 |
|
|
|
18,037 |
|
Net cash used in operating activities |
$ |
(4,837,023 |
) |
|
$ |
(113,928 |
) |
Investing activities |
|
|
|
||||
Purchases of property, equipment, software and intangible assets |
$ |
(75,976 |
) |
|
$ |
(38,445 |
) |
Purchases of available-for-sale investments |
|
(44,974 |
) |
|
|
(205,128 |
) |
Proceeds from sales of available-for-sale investments |
|
23,497 |
|
|
|
15,789 |
|
Proceeds from maturities and paydowns of available-for-sale investments |
|
14,327 |
|
|
|
— |
|
Changes in loans, net |
|
(130,100 |
) |
|
|
— |
|
Proceeds from securitization investments |
|
99,760 |
|
|
|
201,093 |
|
Purchases of non-securitization investments |
|
— |
|
|
|
(20,000 |
) |
Proceeds from non-securitization investments |
|
— |
|
|
|
109,534 |
|
Acquisition of businesses, net of cash acquired |
|
58,540 |
|
|
|
— |
|
Proceeds from repayment of related party notes receivable |
|
— |
|
|
|
16,693 |
|
Net cash provided by (used in) investing activities |
$ |
(54,926 |
) |
|
$ |
79,536 |
|
SoFi Technologies, Inc. Unaudited Condensed Consolidated Statements of Cash Flows (Continued) (In Thousands) |
|||||||
|
Nine Months Ended September 30, |
||||||
|
2022 |
|
2021 |
||||
Financing activities |
|
|
|
||||
Proceeds from debt issuances |
$ |
7,861,804 |
|
|
$ |
6,296,901 |
|
Repayment of debt |
|
(7,306,856 |
) |
|
|
(8,368,904 |
) |
Payment of debt issuance costs |
|
(4,076 |
) |
|
|
(5,136 |
) |
Net change in deposits |
|
4,859,240 |
|
|
|
— |
|
Taxes paid related to net share settlement of share-based awards |
|
(7,476 |
) |
|
|
(37,240 |
) |
Proceeds from stock option exercises |
|
2,489 |
|
|
|
20,642 |
|
Payment of redeemable preferred stock dividends |
|
(20,047 |
) |
|
|
(20,047 |
) |
Finance lease principal payments |
|
(364 |
) |
|
|
(397 |
) |
Purchases of common stock |
|
— |
|
|
|
(526 |
) |
Redemptions of redeemable common and preferred stock |
|
— |
|
|
|
(282,859 |
) |
Proceeds from Business Combination and PIPE Investment |
|
— |
|
|
|
1,989,851 |
|
Payment of costs directly attributable to the issuance of common stock in connection with Business Combination and PIPE Investment |
|
— |
|
|
|
(26,951 |
) |
Net cash provided by (used in) financing activities |
$ |
5,384,714 |
|
|
$ |
(434,666 |
) |
Effect of exchange rates on cash and cash equivalents |
|
231 |
|
|
|
(142 |
) |
Net increase (decrease) in cash, cash equivalents, restricted cash and restricted cash equivalents |
$ |
492,996 |
|
|
$ |
(469,200 |
) |
Cash, cash equivalents, restricted cash and restricted cash equivalents at beginning of period |
|
768,437 |
|
|
|
1,323,428 |
|
Cash, cash equivalents, restricted cash and restricted cash equivalents at end of period |
$ |
1,261,433 |
|
|
$ |
854,228 |
|
|
|
|
|
||||
Reconciliation to amounts on unaudited condensed consolidated balance sheets (as of period end) |
|
|
|
||||
Cash and cash equivalents |
$ |
935,159 |
|
|
$ |
533,523 |
|
Restricted cash and restricted cash equivalents |
|
326,274 |
|
|
|
320,705 |
|
Total cash, cash equivalents, restricted cash and restricted cash equivalents |
$ |
1,261,433 |
|
|
$ |
854,228 |
|
|
|
|
|
||||
SoFi Technologies, Inc. Unaudited Condensed Consolidated Statements of Cash Flows (Continued) (In Thousands) |
|||||||
|
Nine Months Ended September 30, |
||||||
|
2022 |
|
2021 |
||||
Supplemental non-cash investing and financing activities |
|
|
|
||||
Issuance of common stock in acquisition |
$ |
873,377 |
|
$ |
— |
||
Vested awards assumed in acquisition |
|
2,855 |
|
|
|
— |
|
Loans received in acquisition |
|
84,485 |
|
|
|
— |
|
Debt assumed in acquisition |
|
2,000 |
|
|
|
— |
|
Deposits assumed in acquisition |
|
158,016 |
|
|
|
— |
|
Deposits credited but not yet received in cash |
|
14,374 |
|
|
|
||
Available-for-sale securities received in acquisition |
|
10,014 |
|
|
|
— |
|
Property, equipment and software received in acquisition |
|
3,192 |
|
|
|
— |
|
Non-cash loan reduction |
|
1,386 |
|
|
|
— |
|
Share-based compensation capitalized related to internally-developed software |
|
16,177 |
|
|
|
— |
|
Redeemable preferred stock dividends accrued but unpaid |
|
10,189 |
|
|
|
10,189 |
|
Non-cash property, equipment, software and intangible asset additions |
|
— |
|
|
|
859 |
|
Deferred debt issuance costs accrued but unpaid |
|
— |
|
|
|
850 |
|
Securitization investments acquired via loan transfers |
|
— |
|
|
|
89,111 |
|
Available-for-sale investment securities purchased but unpaid |
|
— |
|
|
|
7,712 |
|
Costs directly attributable to the issuance of common stock paid in 2020 |
|
— |
|
|
|
588 |
|
Reduction to temporary equity associated with purchase price adjustments |
|
— |
|
|
|
743 |
|
Warrant liabilities recognized in conjunction with the Business Combination |
|
— |
|
|
|
200,250 |
|
Series H warrant liabilities conversion to common stock warrants |
|
— |
|
|
|
39,959 |
|
Conversion of temporary equity into permanent equity in conjunction with the Business Combination |
|
— |
|
|
|
2,702,569 |
|
Table 5 |
||||||||||||||||||||||||||
Company Metrics |
||||||||||||||||||||||||||
|
September 30, 2022 |
|
June 30, 2022 |
|
March 31, 2022 |
|
December 31, 2021 |
|
September 30, 2021 |
|
June 30, 2021 |
|
March 31, 2021 |
|
December 31, 2020 |
|
September 30, 2020 |
|||||||||
Members |
4,742,673 |
|
4,318,705 |
|
3,868,334 |
|
3,460,298 |
|
2,937,379 |
|
2,560,492 |
|
2,281,092 |
|
1,850,871 |
|
1,500,576 |
|||||||||
Total Products |
7,199,298 |
|
|
6,564,174 |
|
|
5,862,137 |
|
|
5,173,197 |
|
|
4,267,665 |
|
|
3,667,121 |
|
|
3,184,554 |
|
|
2,523,555 |
|
|
2,052,933 |
|
Total Products — Lending segment |
1,280,493 |
|
|
1,202,027 |
|
|
1,138,566 |
|
|
1,078,952 |
|
|
1,030,882 |
|
|
981,440 |
|
|
945,227 |
|
|
917,645 |
|
|
892,934 |
|
Total Products — Financial Services segment |
5,918,805 |
|
|
5,362,147 |
|
|
4,723,571 |
|
|
4,094,245 |
|
|
3,236,783 |
|
|
2,685,681 |
|
|
2,239,327 |
|
|
1,605,910 |
|
|
1,159,999 |
|
Total Accounts — Technology Platform segment(1) |
124,332,810 |
|
|
116,570,038 |
|
|
109,687,014 |
|
|
99,660,657 |
|
|
88,811,022 |
|
|
78,902,156 |
|
|
69,572,680 |
|
|
59,735,210 |
|
|
49,276,594 |
|
(1) |
|
Beginning in the fourth quarter of 2021, the Company included SoFi accounts on the Galileo platform-as-a-service in its total Technology Platform accounts metric to better align with the presentation of Technology Platform segment revenue. Quarterly amounts for the earlier quarters in 2021 and 2020 were determined to be immaterial, and as such were not recast. |
Members
We refer to our customers as “members”. We define a member as someone who has had a lending relationship with us through origination and/or ongoing servicing, opened a financial services account, linked an external account to our platform, or signed up for our credit score monitoring service. Once someone becomes a member, they are always considered a member unless they violate our terms of service. Our members have continuous access to our certified financial planners, our career advice services, our member events, our content, educational material, news, tools and calculators, which are provided at no cost to the member. We view members as an indication not only of the size and a measurement of growth of our business, but also as a measure of the significant value of the data we have collected over time.
Total Products
Total products refers to the aggregate number of lending and financial services products that our members have selected on our platform since our inception through the reporting date, whether or not the members are still registered for such products. In our Lending segment, total products refers to the number of home loans, personal loans and student loans that have been originated through our platform through the reporting date, whether or not such loans have been paid off. If a member has multiple loan products of the same loan product type, such as two personal loans, that is counted as a single product. However, if a member has multiple loan products across loan product types, such as one personal loan and one home loan, that is counted as two products. In our Financial Services segment, total products refers to the number of SoFi Money accounts (presented inclusive of SoFi Money cash management accounts and SoFi Checking and Savings accounts held at SoFi Bank), SoFi Invest accounts, SoFi Credit Card accounts (including accounts with a zero dollar balance at the reporting date), referred loans (which relate to an arrangement in the third quarter of 2021 and are originated by a third-party partner to which we provide pre-qualified borrower referrals), SoFi At Work accounts and SoFi Relay accounts (with either credit score monitoring enabled or external linked accounts) that have been opened through our platform through the reporting date. Our SoFi Invest service is composed of three products: active investing accounts, robo-advisory accounts and digital assets accounts. Our members can select any one or combination of the three types of SoFi Invest products. If a member has multiple SoFi Invest products of the same account type, such as two active investing accounts, that is counted as a single product. However, if a member has multiple SoFi Invest products across account types, such as one active investing account and one robo-advisory account, those separate account types are considered separate products. Total products is a primary indicator of the size and reach of our Lending and Financial Services segments. Management relies on total products metrics to understand the effectiveness of our member acquisition efforts and to gauge the propensity for members to use more than one product.
Technology Platform Total Accounts
In our Technology Platform segment, total accounts refers to the number of open accounts at Galileo as of the reporting date. Beginning in the fourth quarter of 2021, we included SoFi accounts on the Galileo platform-as-a-service in our total accounts metric to better align with the Technology Platform segment revenue, which includes intercompany revenue from SoFi. We recast the accounts in the fourth quarters of 2021 and 2020, but did not recast the accounts for the earlier quarters in 2021 and 2020, as the impact was determined to be immaterial. Total accounts is a primary indicator of the accounts dependent upon Galileo’s technology platform to use virtual card products, virtual wallets, make peer-to-peer and bank-to-bank transfers, receive early paychecks, separate savings from spending balances, make debit transactions and rely upon real-time authorizations, all of which result in revenues for the Technology Platform segment. We do not measure total accounts for the Technisys products and solutions, as the revenue model is not dependent upon being a fully integrated, stand-ready service.
Table 6 |
||||||||||||||||||||||||||||||||||||
Segment Financials |
||||||||||||||||||||||||||||||||||||
|
|
Quarter Ended |
||||||||||||||||||||||||||||||||||
($ in thousands) |
|
September 30, 2022 |
|
June 30, 2022 |
|
March 31, 2022 |
|
December 31, 2021 |
|
September 30, 2021 |
|
June 30, 2021 |
|
March 31, 2021 |
|
December 31, 2020 |
|
September 30, 2020 |
||||||||||||||||||
Lending |
|
|
|
|
|
|
|
|
|
|
|
|
|
|
|
|
|
|
||||||||||||||||||
Net interest income |
|
$ |
139,516 |
|
|
$ |
114,003 |
|
|
$ |
94,354 |
|
|
$ |
77,246 |
|
|
$ |
72,257 |
|
|
$ |
56,822 |
|
|
$ |
51,777 |
|
|
$ |
57,127 |
|
|
$ |
52,222 |
|
Total noninterest income |
|
|
162,178 |
|
|
|
143,114 |
|
|
|
158,635 |
|
|
|
136,518 |
|
|
|
138,034 |
|
|
|
109,469 |
|
|
|
96,200 |
|
|
|
91,865 |
|
|
|
109,890 |
|
Total net revenue |
|
|
301,694 |
|
|
|
257,117 |
|
|
|
252,989 |
|
|
|
213,764 |
|
|
|
210,291 |
|
|
|
166,291 |
|
|
|
147,977 |
|
|
|
148,992 |
|
|
|
162,112 |
|
Adjusted net revenue(1) |
|
|
296,965 |
|
|
|
250,681 |
|
|
|
244,372 |
|
|
|
208,032 |
|
|
|
215,475 |
|
|
|
172,232 |
|
|
|
168,037 |
|
|
|
159,520 |
|
|
|
178,084 |
|
Contribution profit |
|
|
180,562 |
|
|
|
141,991 |
|
|
|
132,651 |
|
|
|
105,065 |
|
|
|
117,668 |
|
|
|
89,188 |
|
|
|
87,686 |
|
|
|
85,204 |
|
|
|
103,011 |
|
Technology Platform |
|
|
|
|
|
|
|
|
|
|
|
|
|
|
|
|
|
|
||||||||||||||||||
Net interest income (expense) |
|
$ |
— |
|
|
$ |
— |
|
|
$ |
— |
|
|
$ |
— |
|
|
$ |
39 |
|
|
$ |
(32 |
) |
|
$ |
(36 |
) |
|
$ |
(42 |
) |
|
$ |
(47 |
) |
Total noninterest income |
|
|
84,777 |
|
|
|
83,899 |
|
|
|
60,805 |
|
|
|
53,299 |
|
|
|
50,186 |
|
|
|
45,329 |
|
|
|
46,101 |
|
|
|
37,524 |
|
|
|
38,865 |
|
Total net revenue(2) |
|
|
84,777 |
|
|
|
83,899 |
|
|
|
60,805 |
|
|
|
53,299 |
|
|
|
50,225 |
|
|
|
45,297 |
|
|
|
46,065 |
|
|
|
37,482 |
|
|
|
38,818 |
|
Contribution profit |
|
|
19,536 |
|
|
|
21,841 |
|
|
|
18,255 |
|
|
|
20,008 |
|
|
|
15,741 |
|
|
|
13,013 |
|
|
|
15,685 |
|
|
|
16,806 |
|
|
|
23,986 |
|
Financial Services |
|
|
|
|
|
|
|
|
|
|
|
|
|
|
|
|
|
|
||||||||||||||||||
Net interest income |
|
$ |
28,158 |
|
|
$ |
12,925 |
|
|
$ |
5,882 |
|
|
$ |
1,785 |
|
|
$ |
1,209 |
|
|
$ |
542 |
|
|
$ |
229 |
|
|
$ |
88 |
|
|
$ |
98 |
|
Total noninterest income |
|
|
20,795 |
|
|
|
17,438 |
|
|
|
17,661 |
|
|
|
20,171 |
|
|
|
11,411 |
|
|
|
16,497 |
|
|
|
6,234 |
|
|
|
3,963 |
|
|
|
3,139 |
|
Total net revenue |
|
|
48,953 |
|
|
|
30,363 |
|
|
|
23,543 |
|
|
|
21,956 |
|
|
|
12,620 |
|
|
|
17,039 |
|
|
|
6,463 |
|
|
|
4,051 |
|
|
|
3,237 |
|
Contribution loss(2) |
|
|
(52,623 |
) |
|
|
(53,700 |
) |
|
|
(49,515 |
) |
|
|
(35,189 |
) |
|
|
(39,465 |
) |
|
|
(24,745 |
) |
|
|
(35,519 |
) |
|
|
(36,753 |
) |
|
|
(37,467 |
) |
Corporate/Other |
|
|
|
|
|
|
|
|
|
|
|
|
|
|
|
|
|
|
||||||||||||||||||
Net interest expense |
|
$ |
(9,824 |
) |
|
$ |
(4,199 |
) |
|
$ |
(5,303 |
) |
|
$ |
(2,454 |
) |
|
$ |
(1,130 |
) |
|
$ |
(1,320 |
) |
|
$ |
(4,690 |
) |
|
$ |
(18,350 |
) |
|
$ |
(3,061 |
) |
Total noninterest income (loss) |
|
|
(1,615 |
) |
|
|
(4,653 |
) |
|
|
(1,690 |
) |
|
|
(957 |
) |
|
|
— |
|
|
|
3,967 |
|
|
|
169 |
|
|
|
(684 |
) |
|
|
(319 |
) |
Total net revenue (loss)(2) |
|
|
(11,439 |
) |
|
|
(8,852 |
) |
|
|
(6,993 |
) |
|
|
(3,411 |
) |
|
|
(1,130 |
) |
|
|
2,647 |
|
|
|
(4,521 |
) |
|
|
(19,034 |
) |
|
|
(3,380 |
) |
Consolidated |
|
|
|
|
|
|
|
|
|
|
|
|
|
|
|
|
|
|
||||||||||||||||||
Net interest income |
|
$ |
157,850 |
|
|
$ |
122,729 |
|
|
$ |
94,933 |
|
|
$ |
76,577 |
|
|
$ |
72,375 |
|
|
$ |
56,012 |
|
|
$ |
47,280 |
|
|
$ |
38,823 |
|
|
$ |
49,212 |
|
Total noninterest income. |
|
|
266,135 |
|
|
|
239,798 |
|
|
|
235,411 |
|
|
|
209,031 |
|
|
|
199,631 |
|
|
|
175,262 |
|
|
|
148,704 |
|
|
|
132,668 |
|
|
|
151,575 |
|
Total net revenue |
|
|
423,985 |
|
|
|
362,527 |
|
|
|
330,344 |
|
|
|
285,608 |
|
|
|
272,006 |
|
|
|
231,274 |
|
|
|
195,984 |
|
|
|
171,491 |
|
|
|
200,787 |
|
Adjusted net revenue(1) |
|
|
419,256 |
|
|
|
356,091 |
|
|
|
321,727 |
|
|
|
279,876 |
|
|
|
277,190 |
|
|
|
237,215 |
|
|
|
216,044 |
|
|
|
182,019 |
|
|
|
216,759 |
|
Net loss |
|
|
(74,209 |
) |
|
|
(95,835 |
) |
|
|
(110,357 |
) |
|
|
(111,012 |
) |
|
|
(30,047 |
) |
|
|
(165,314 |
) |
|
|
(177,564 |
) |
|
|
(82,616 |
) |
|
|
(42,878 |
) |
Adjusted EBITDA(1) |
|
|
44,298 |
|
|
|
20,304 |
|
|
|
8,684 |
|
|
|
4,593 |
|
|
|
10,256 |
|
|
|
11,240 |
|
|
|
4,132 |
|
|
|
11,817 |
|
|
|
33,509 |
|
(1) |
|
Adjusted net revenue and adjusted EBITDA are non-GAAP financial measures. For additional information on these measures and reconciliations to the most directly comparable GAAP measures, see “Non-GAAP Financial Measures” and Table 2 to the “Financial Tables” herein. |
(2) |
|
Technology Platform segment total net revenue includes intercompany fees earned by Galileo from SoFi, which is a Galileo client. There is an equal and offsetting expense reflected within the Financial Services segment contribution loss representing the intercompany fees incurred to Galileo. The intercompany revenue and expense are eliminated in consolidation. The revenue is eliminated within “Corporate/Other” and the expense represents a reconciling item of segment contribution profit (loss) to consolidated loss before income taxes. For the year ended December 31, 2021, all intercompany amounts were reflected in the fourth quarter, as inter-quarter amounts were determined to be immaterial. Additionally, for the three months ended June 30, 2022 and September 30, 2022, total net revenue for the Technology Platform segment included intercompany fees earned by Technisys from Galileo, which is a Technisys client. There is an equal and offsetting expense reflected within the Technology Platform segment directly attributable expenses representing the intercompany fees incurred by Galileo to Technisys. The intercompany revenue and expense are eliminated in consolidation. The revenue is eliminated within Corporate/Other and the expense is adjusted in our reconciliation of directly attributable expenses. |
SOFI-F
View source version on businesswire.com: https://www.businesswire.com/news/home/20221101005542/en/
Contacts
Investors:
SoFi Investor Relations
IR@sofi.com
Media:
SoFi Media Relations
PR@sofi.com


