
Within the 11 S&P 500 sectors, utilities and real estate investment trusts (REITs) have developed a reputation over the years. They have higher yields than most other sectors, and their staid businesses, more about consistent cash flow than rapid growth, made them appeal to certain equity managers.
Specifically, when stocks would falter but bonds would rally, professional managers would load up on these sectors. Rates down, REITs up. And utility stocks, too.
Times have changed in so many ways. Too many to list here. And one of the things that has changed is how these two sectors behave. The REIT sector as a whole does not yield nearly as much as it did. That’s in large part because data center and cell tower REITs now have a high allocation within that sector.
Utilities have been uncharacteristically “growthy,” thanks to the markets seeing that sector as a player in the growth of artificial intelligence (AI). They are the power suppliers. And we are going to need a lot of that.
What's Going on With These 2 Sectors?
The recent climb in S&P 500 Utilities Sector SPDR (XLU) and S&P 500 Real Estate Sector SPDR (XLRE) is a clear narrative showing these sectors reclaiming their roles as bond substitutes. While the broader market has been volatile, these groups have capitalized on a specific shift in the fixed-income landscape — the retreat of Treasury yields from their recent peaks.
The upward momentum in these sectors is almost entirely tethered to the movement of the 10-year Treasury Note (ZNH26). As Treasury yields fall, the fixed dividend payments of utilities and REITs become more competitive for income-seeking investors.
Both sectors are highly capital-intensive and carry significant debt loads; lower yields signal a drop in future funding costs, which is a massive tailwind for their bottom lines. And, markets currently expect the Fed to continue toward a neutral policy stance, which has stabilized the bond market and allowed these rate-sensitive equities to find a firm footing.
A Closer Look at XLU and XLRE
Here’s a look at both XLRE and XLU — their top-10 holdings and their charts.
XLRE represents the 35 REITs within the S&P 500 Index ($SPX). Those tech-oriented holdings crowd the top, as we see 60% of the exchange-traded fund (ETF) is in just 10 holdings. Most of those are the non-traditional, lower-yielding types.
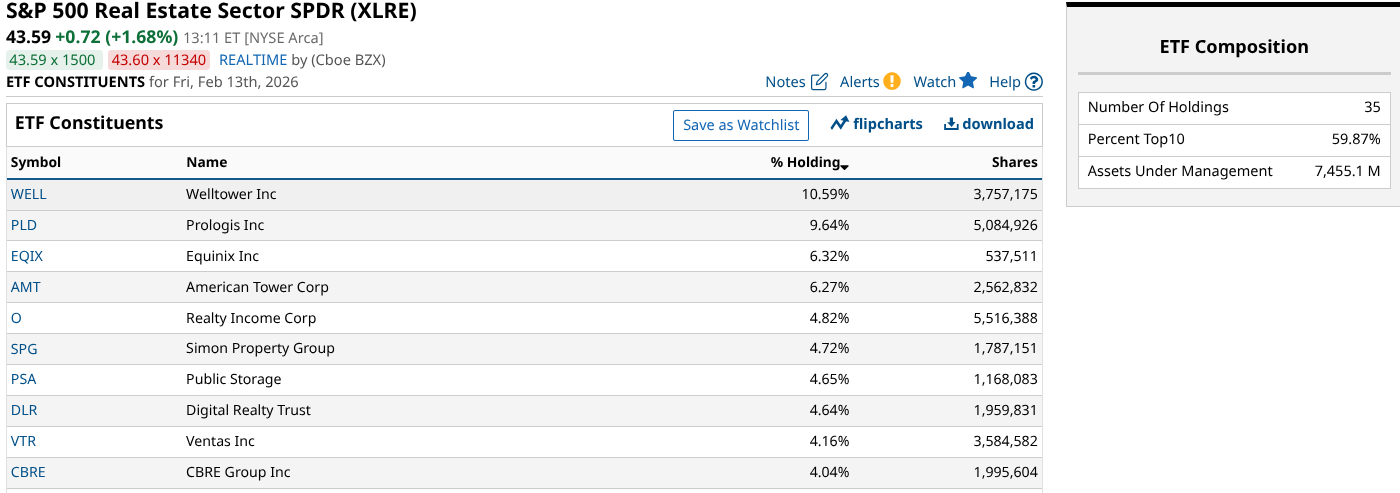
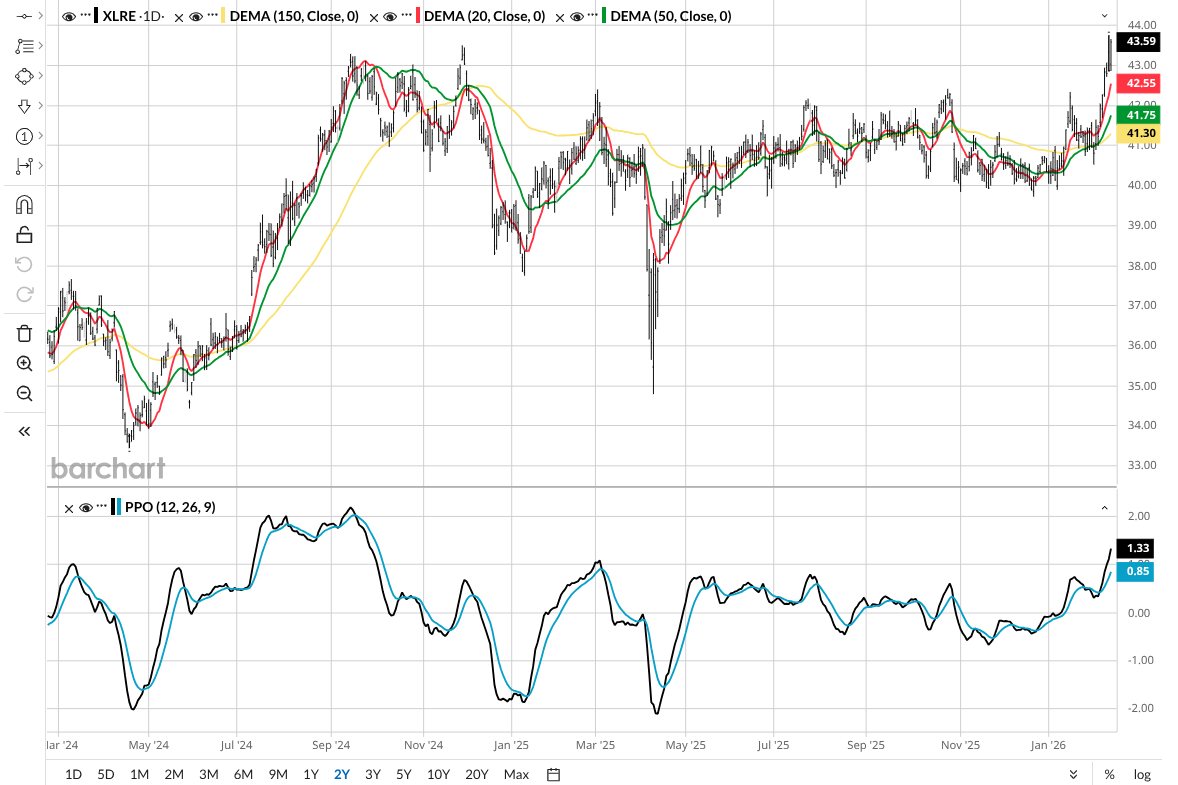
XLRE’s chart is hinting at a breakout. But remember, that may only be as good as the continued decline in Treasury yields.
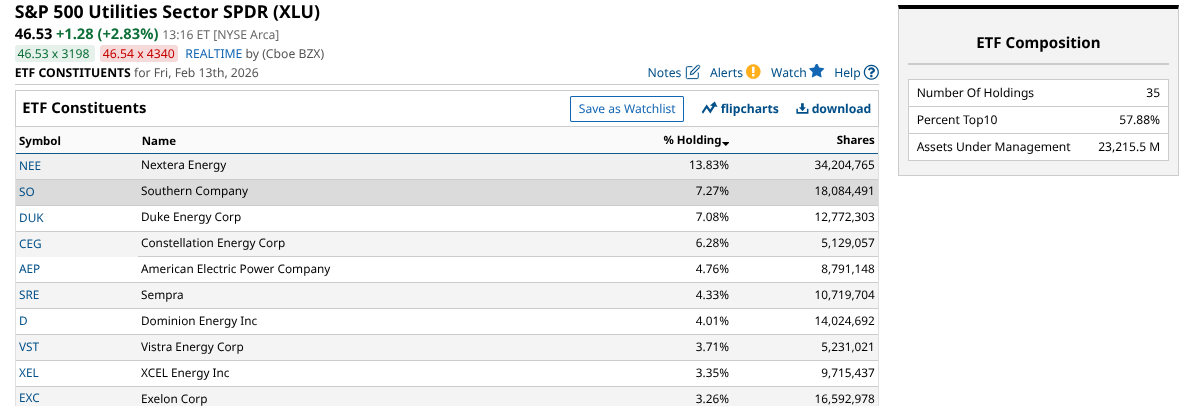
XLU coincidentally has the same number of stocks and a similar level of concentration.
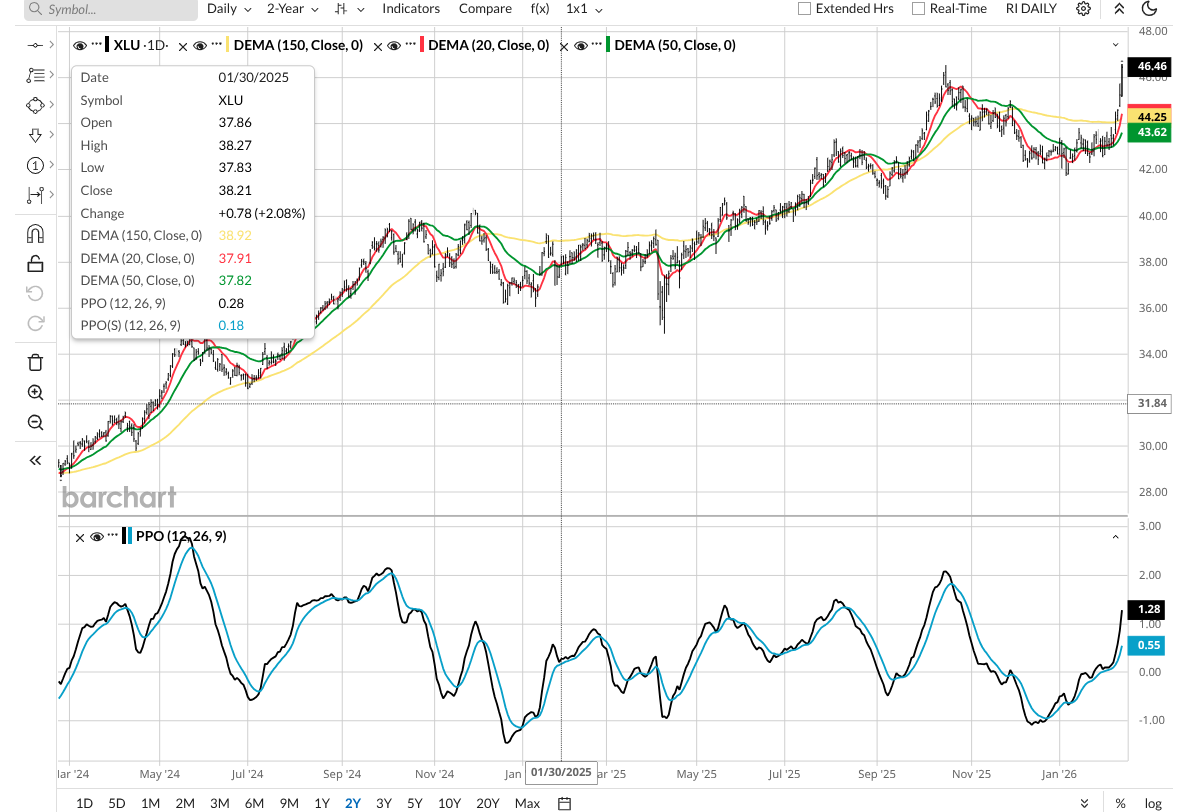
Perhaps not surprisingly, XLU’s chart looks similar to that of XLRE. Remember, there’s a powerful macro theme at work here. XLU is also bordering on a breakout.
Risks to Continued Gains in XLRE and XLU
Rising federal debt levels and massive Treasury issuance could flood the market with supply, potentially forcing yields back up and quickly reversing the gains in XLU and XLRE. And if inflation data surprises to the upside, the Fed may be forced to hold rates higher for longer, which would lessen the attractiveness of these high-dividend-payers compared to "risk-free" government debt.
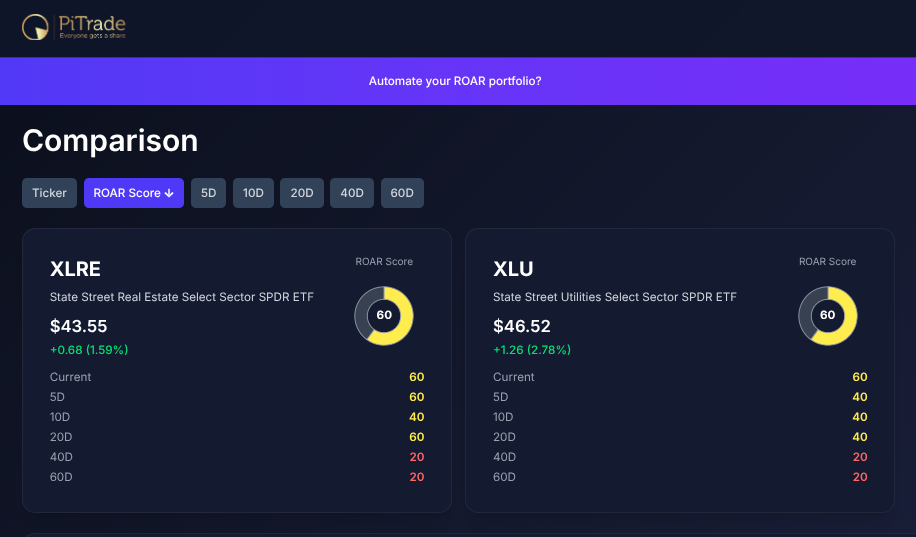
I quickly ran reward opportunity and risk (ROAR) scores for these two ETFs. No surprise: They both scored at the same level of 60. That means their current chart pattern indicates slightly lower-than-normal risk.
In simpler terms, there’s a 60% chance their next 10% move will be higher and a 40% chance that next 10% change in price will be lower. ROAR anticipated the recent rallies, as shown by the increase in ROAR scores over the past few months.
The Takeaway
For traders, this is a classic case of “know what you own and why you own it.” If you think these sectors are moving because of their fundamental details, think again. Today’s markets don’t work that way. This is primarily about interest rates. And about the market sticking to an old-fashioned impulse to treat these sectors the way they have in the past.
My personal approach to this is perhaps an example readers can learn from. The biggest part of my portfolio? A laddered mix of zero-coupon U.S. Treasury bonds. That’s my way to play a sustained lower-yield environment. XLRE and XLU can be traded along those same lines. But don’t fool yourself. These are still bond surrogates. Even if the fundamental picture of REITs and utilities is vastly different from what it was years ago.
Rob Isbitts created the ROAR Score, based on his 40+ years of technical analysis experience. ROAR helps DIY investors manage risk and create their own portfolios. For Rob's written research, check out ETFYourself.com.
On the date of publication, Rob Isbitts did not have (either directly or indirectly) positions in any of the securities mentioned in this article. All information and data in this article is solely for informational purposes. For more information please view the Barchart Disclosure Policy here.
More news from Barchart


