Data Revenue increases 30% year over year
TORONTO, ON / ACCESSWIRE / November 19, 2021 / EQ Inc. (TSXV:EQ) ("EQ Works" or the "Company"), a leader in geospatial data and artificial intelligence driven software, announced its financial results today, for the third quarter ended September 30, 2021.
Revenue for the third quarter of over $3.1 million, was an increase of 9% when compared to the third quarter of 2020 and was the second highest quarter over the last 8 years. This revenue growth was the result of continued traction in the data business, which increased 30% compared to the same period a year ago, new client bookings for analytics and media execution, additional recurring revenue through the licencing of our LOCUS platform and a continued focus on proprietary solutions for our key verticals. Visibility into the fourth quarter is strong and the Company expects fourth quarter revenue to be at least 30% higher than what was generated in the third quarter.
Highlights for the Third Quarter ended September 30, 2021
- Revenue for the third quarter of over $3.1 million, was an increase of 9% compared to the third quarter of 2020;
- Data revenue increased by 30% compared to the same period a year ago and 15% sequentially;
- Cash balance at the end of the quarter was $9.8 million;
- Contract extension was awarded to EQ for a multi-year engagement with a leading Canadian university;
- New partnership with SafeGraph resulted in the creation of Canada's largest geospatial dataset;
- Launch of LOCUS Commute to help retailers, insurance providers and out of home networks to better understand movement behavior of Canadians; and
- The Company acquired Integrated Rewards Inc. and their branded Paymi application ("Paymi"). Paymi adds a new consumer line of business to the Company that will generate incremental revenue and provide a new proprietary and powerful first-party data set to the LOCUS platform.
The Company has also made great strides with Paymi since the close of the acquisition. Along with a complete overhaul of the application, which greatly improved the user experience, there have been considerable upgrades to the customer value proposition. During the quarter, Paymi more than doubled its existing partner base, with a broad range of companies across multiple verticals and an aggressive user-acquisition strategy led to a significant increase in downloads and user activity on the app significantly increased.
Our advertising division has continued to perform well, even with some budget delays relating to supply chain challenges faced by our automotive customers. Purchase orders in excess of $500,000 were paused during the quarter, without which our year over year and sequential quarterly revenue increases would have been 26% and 20% respectively. These delays are expected to resolve themselves over the coming quarters and budget approvals and campaign relaunches should have a positive impact on our financials performance.
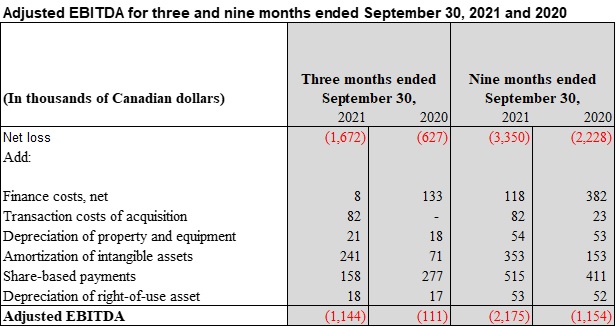
Major expenditures during the quarter were the acquisition of Paymi, ongoing technology development investments and talent recruitment for data scientists and sales and marketing personnel. These disbursements resulted in an adjusted EBITDA loss for the quarter of approximately $1.1 million.
"We are pleased with our continued progress and excited about leveraging this momentum to have a strong end to the year and aggressively push into 2022" said Geoffrey Rotstein, President and CEO of EQ Works. "Our revenue growth, and especially that of our data division, shows the importance of our solutions and with the addition of Paymi, we have strengthened our offering even more. With our proprietary data sets, leveraging consent based zero-party data solutions, we continue to produce unprecedented, actionable insights for clients."
Subsequent to quarter-end, the Company granted 265,000 stock options to employees of the Company. These stock options are exercisable at CDN $1.27 per stock option and will expire on November 18, 2026. These stock options vest over a period of forty-eight months following the grant date and are governed by the terms and conditions of the Company's stock options plan. Following this grant of stock options, the Company has a total of 3,942,667 stock options outstanding representing approximately 5.8% of the outstanding common shares of the Company.
In addition, the Company is currently disputing certain amounts owing as an earnout from a previous acquisition. On October 15, 2018, the Company entered into a share purchase transaction to purchase 100% of the shares of Tapped Networks Inc. ("Tapped Mobile"). The acquisition agreement (the "Agreement") provided for an upfront payment of Common Shares in EQ Inc. and an additional earnout payment of up to $2.8 million based on the achievement of certain predetermined revenue and gross profit targets over the 24-month period following the closing of the acquisition. The Agreement further specified that based on the earnout, Tapped Mobile shareholders could earn up to $1.4 million in the first year and the remaining $1.4 million in the second year based on the predetermined revenue and gross profit targets for those periods. The first year earnout payment was agreed to based on the revenue and gross profit targets generated that year, however, the two parties are currently in dispute regarding the amount owing related to the second year earnout. The Ontario Superior Court ruled that the Company was to pay the former shareholders of Tapped Mobile the entire amount for the second year earnout under the Share Purchase Agreement. The Company does not agree with this judgement and as a result has retained legal counsel and will be appealing this decision.
Non-IFRS Financial Measures
EQ Works measures the success of the Company's strategies and performance based on Adjusted EBITDA, which is outlined and reconciled with net income (loss) in the section entitled "Reconciliation of Net Loss for the period to Adjusted EBITDA" in the MD&A. The Company defines Adjusted EBITDA as net income (loss) from operations before: (a) depreciation of property and equipment and amortization of intangible assets, (b) share-based payments, (c) finance income and costs, net, (d) depreciation of right-of-use assets, and (e) transaction costs of acquisition. Management uses Adjusted EBITDA as a measure of the Company's operating performance because it provides information on the Company's ability to provide operating cash flows for working capital requirements, capital expenditures, and potential acquisitions. The Company also believes that analysts and investors use Adjusted EBITDA as a supplemental measure to evaluate the overall operating performance of companies in its industry.
The non-IFRS financial measure is used in addition to, and in conjunction with, results presented in the Company's consolidated financial statements prepared in accordance with IFRS and should not be relied upon to the exclusion of IFRS financial measures. Management strongly encourages investors to review the Company's consolidated financial statements in their entirety and to not rely on any single financial measure. Because non-IFRS financial measures are not standardized, it may not be possible to compare these financial measures with other companies' non-IFRS financial measures having the same or similar names. In addition, the Company expects to continue to incur expenses similar to the non-IFRS adjustments described above, and exclusion of these items from the Company's non-IFRS measures should not be construed as an inference that these costs are unusual, infrequent, or non-recurring.
The table below reconciles net loss from operations and Adjusted EBITDA for the periods presented:
About EQ Works
EQ Works (www.eqworks.com) enables businesses to understand, predict, and influence customer behaviour. Using unique data sets, advanced analytics, machine learning and artificial intelligence, EQ Works creates actionable intelligence for businesses to attract, retain, and grow the customers that matter most. The Company's proprietary SaaS platform mines insights from movement and geospatial data, enabling businesses to close the loop between digital and real-world consumer actions.
Neither the TSX-V nor its Regulation Services Provider (as that term is defined in policies of the TSX-V) accepts responsibility for the adequacy or accuracy of this release.
Forward-Looking Statements
Certain statements contained in this press release constitute "forward-looking statements". All statements other than statements of historical fact contained in this press release, including, without limitation, those regarding the Company's ability to adjust to customer needs in light of COVID-19, the delivery of acceleration notices to the holders of Warrants and the exercise of the Warrants by holders, future financial position and results of operations, strategy, plans, objectives, goals and targets, and any statements preceded by, followed by or that include the words "believe", "expect", "aim", "intend", "plan", "continue", "will", "may", "would", "anticipate", "estimate", "forecast", "predict", "project", "seek", "should" or similar expressions, or the negative thereof, are forward-looking statements. These statements are not historical facts but instead represent only the Company's expectations, estimates, and projections regarding future events. These statements are not guarantees of future performance and involve assumptions, risks, and uncertainties that are difficult to predict. Therefore, actual results may differ materially from what is expressed, implied, or forecasted in such forward-looking statements. Additional factors that could cause actual results, performance, or achievements to differ materially include, but are not limited to, the risk factors discussed in the Company's MD&A for the three and nine months ended September 30, 2021. Management provides forward-looking statements because it believes they provide useful information to investors when considering their investment objectives but cautions investors not to place undue reliance on forward-looking information. Consequently, all of the forward-looking statements made in this press release are qualified by these cautionary statements and any other cautionary statements or factors contained herein, and there can be no assurance that the actual results or developments will be realized or, even if substantially realized, that they will have the expected consequences to, or effects on, the Company. These forward-looking statements are made as of the date of this press release, and the Company assumes no obligation to update or revise them to reflect subsequent information, events, or circumstances or otherwise, except as required by law.
EQ Inc.
Peter Kanniah, Chief Financial Officer
1235 Bay Street, Suite 401| Toronto, Ontario |M5R 3K4
press@eqworks.com
www.eqworks.com
Bill Mitoulas, Investor Relations
416-479-9547
bill@venturenorthcapital.com
EQ Inc.
Unaudited Condensed Consolidated Interim Statements of Financial Position
(In thousands of Canadian dollars)
| September 30, 2021 | December 31, 2020 | |||||||
Assets | ||||||||
Current assets: | ||||||||
Cash | $ | 9,809 | $ | 3,209 | ||||
Accounts receivable | 4,192 | 4,572 | ||||||
Other current assets | 243 | 197 | ||||||
| 14,244 | 7,978 | |||||||
Non-current assets: | ||||||||
Property and equipment | 117 | 102 | ||||||
Right-of-use asset | 23 | 76 | ||||||
Intangible asset | 2,525 | 1,096 | ||||||
Goodwill | 1,901 | 732 | ||||||
| 4,566 | 2,006 | |||||||
Total assets | $ | 18,810 | $ | 9,984 | ||||
Liabilities and Shareholders' Equity | ||||||||
Current liabilities: | ||||||||
Accounts payable and accrued liabilities | $ | 3,457 | $ | 2,908 | ||||
Rewards payable | 942 | - | ||||||
Lease liability | 166 | 132 | ||||||
Loans and borrowings | - | 1,989 | ||||||
Contract liabilities | 68 | 86 | ||||||
Earn-out | 186 | 222 | ||||||
| 4,819 | 5,337 | |||||||
Non-current liabilities: | ||||||||
Lease liability | - | 18 | ||||||
Loans and borrowings | 120 | 80 | ||||||
| 120 | 98 | |||||||
Shareholders' equity | 13,871 | 4,549 | ||||||
Total liabilities and shareholders' equity | $ | 18,810 | $ | 9,984 | ||||
EQ Inc.
Unaudited Condensed Consolidated Interim Statements of Loss and Comprehensive Loss
(In thousands of Canadian dollars, except per share amounts)
Three and nine months ended September 30, 2021 and 2020
| Three months ended September 30, | Nine months ended September 30, | |||||||||||||||
| 2021 | 2020 | 2021 | 2020 | |||||||||||||
Revenue | $ | 3,104 | $ | 2,851 | $ | 7,868 | $ | 6,775 | ||||||||
Expenses: | ||||||||||||||||
Publishing costs | 1,908 | 1,437 | 4,592 | 3,788 | ||||||||||||
Employee compensation and benefits | 1,459 | 1,309 | 3,776 | 3,175 | ||||||||||||
Other operating expenses | 1,039 | 493 | 2,190 | 1,377 | ||||||||||||
Depreciation of property and equipment | 21 | 18 | 54 | 53 | ||||||||||||
Depreciation of right-of-use asset | 18 | 17 | 53 | 52 | ||||||||||||
Amortization of intangible assets | 241 | 71 | 353 | 153 | ||||||||||||
| 4,686 | 3,345 | 11,018 | 8,598 | |||||||||||||
Loss from operations | (1,582 | ) | (494 | ) | (3,150 | ) | (1,823 | ) | ||||||||
Transaction costs of acquisition | (82 | ) | - | (82 | ) | (23 | ) | |||||||||
Finance income | 30 | 4 | 18 | 27 | ||||||||||||
Finance costs | (38 | ) | (137 | ) | (136 | ) | (409 | ) | ||||||||
Loss before income taxes | (1,672 | ) | (627 | ) | (3,350 | ) | (2,228 | ) | ||||||||
Net loss | (1,672 | ) | (627 | ) | (3,350 | ) | (2,228 | ) | ||||||||
Loss per share: | ||||||||||||||||
Basic and diluted | (0.02 | ) | (0.01 | ) | (0.05 | ) | (0.04 | ) | ||||||||
EQ Inc.
Unaudited Condensed Consolidated Interim Statements of Cash Flows
(In thousands of Canadian dollars)
Nine months ended September 30, 2021 and 2020
| 2021 | 2020 | |||||||
Cash flows from operating activities: | ||||||||
Net loss | (3,350 | ) | (2,228 | ) | ||||
Adjustments to reconcile net loss to net cash flows | ||||||||
from operating activities: | ||||||||
Depreciation of property and equipment | 54 | 53 | ||||||
Depreciation of right-of-use asset | 53 | 52 | ||||||
Amortization of intangible assets | 353 | 153 | ||||||
Share-based payments | 515 | 411 | ||||||
Unrealized foreign exchange gain | (11 | ) | (23 | ) | ||||
Transaction Costs | 82 | 23 | ||||||
Finance cost, net | 99 | 406 | ||||||
Change in non-cash operating working capital | (286 | ) | (263 | ) | ||||
Net cash used in operating activities | (2,491 | ) | (1,416 | ) | ||||
Cash flows from financing activities: | ||||||||
Repayment of obligations under property lease | (71 | ) | (139 | ) | ||||
Loans and borrowings | 40 | 80 | ||||||
Repayment of promissory notes | (1,717 | ) | - | |||||
Proceeds from exercise of warrants | 1,392 | 3,658 | ||||||
Proceeds from public offer | 11,500 | - | ||||||
Share issuance costs | (761 | ) | - | |||||
Proceeds from exercise of stock options | 26 | 114 | ||||||
Interest paid | (293 | ) | (3 | ) | ||||
Net cash from financing activities | 10,116 | 3,710 | ||||||
Cash flows from investing activities: | ||||||||
Interest income received | 18 | 5 | ||||||
Earn-out payout | (36 | ) | - | |||||
Acquisition | (459 | ) | (850 | ) | ||||
Transaction costs of acquisition | - | (23 | ) | |||||
Purchases of property and equipment | (53 | ) | (64 | ) | ||||
Addition of intangible asset | (506 | ) | (425 | ) | ||||
Net cash used in investing activities | (1,036 | ) | (1,357 | ) | ||||
Increase in cash | 6,589 | 937 | ||||||
Foreign exchange gain on cash held in foreign currency | 11 | 23 | ||||||
Cash, beginning of the period | 3,209 | 3,691 | ||||||
Cash, end of the period | $ | 9,809 | $ | 4,651 | ||||
SOURCE: EQ Inc.
View source version on accesswire.com:
https://www.accesswire.com/673739/EQ-Inc-Reports-Third-Quarter-Financial-Results