
Maintenance and repair supplier W.W. Grainger (NYSE: GWW) reported revenue ahead of Wall Street’s expectations in Q2 CY2025, with sales up 5.6% year on year to $4.55 billion. On the other hand, the company’s full-year revenue guidance of $17.85 billion at the midpoint came in 0.5% below analysts’ estimates. Its GAAP profit of $9.97 per share was 0.9% below analysts’ consensus estimates.
Is now the time to buy W.W. Grainger? Find out by accessing our full research report, it’s free.
W.W. Grainger (GWW) Q2 CY2025 Highlights:
- Revenue: $4.55 billion vs analyst estimates of $4.53 billion (5.6% year-on-year growth, 0.6% beat)
- EPS (GAAP): $9.97 vs analyst expectations of $10.06 (0.9% miss)
- Adjusted EBITDA: $765 million vs analyst estimates of $743.8 million (16.8% margin, 2.8% beat)
- The company reconfirmed its revenue guidance for the full year of $17.85 billion at the midpoint
- EPS (GAAP) guidance for the full year is $40.25 at the midpoint, roughly in line with what analysts were expecting
- Operating Margin: 14.9%, in line with the same quarter last year
- Free Cash Flow Margin: 4.4%, down from 7.8% in the same quarter last year
- Organic Revenue rose 5.1% year on year, in line with the same quarter last year
- Market Capitalization: $49.94 billion
"Our team remains focused on our customers, fostering deep relationships, providing exceptional service and driving innovation through differentiated capabilities," said D.G. Macpherson, Chairman and CEO.
Company Overview
Founded as a supplier of motors, W.W. Grainger (NYSE: GWW) provides maintenance, repair, and operating (MRO) supplies and services to businesses and institutions.
Revenue Growth
A company’s long-term sales performance can indicate its overall quality. Any business can experience short-term success, but top-performing ones enjoy sustained growth for years. Over the last five years, W.W. Grainger grew its sales at a decent 8.5% compounded annual growth rate. Its growth was slightly above the average industrials company and shows its offerings resonate with customers.
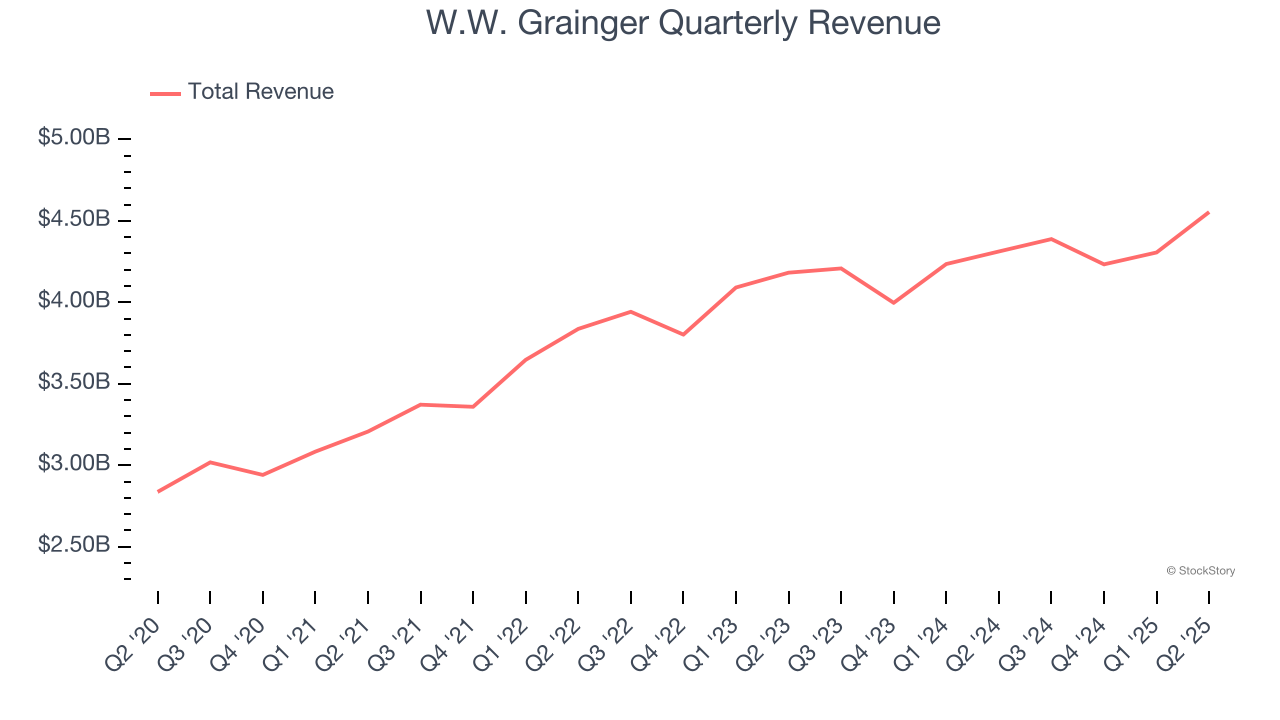
Long-term growth is the most important, but within industrials, a half-decade historical view may miss new industry trends or demand cycles. W.W. Grainger’s recent performance shows its demand has slowed as its annualized revenue growth of 4.5% over the last two years was below its five-year trend. 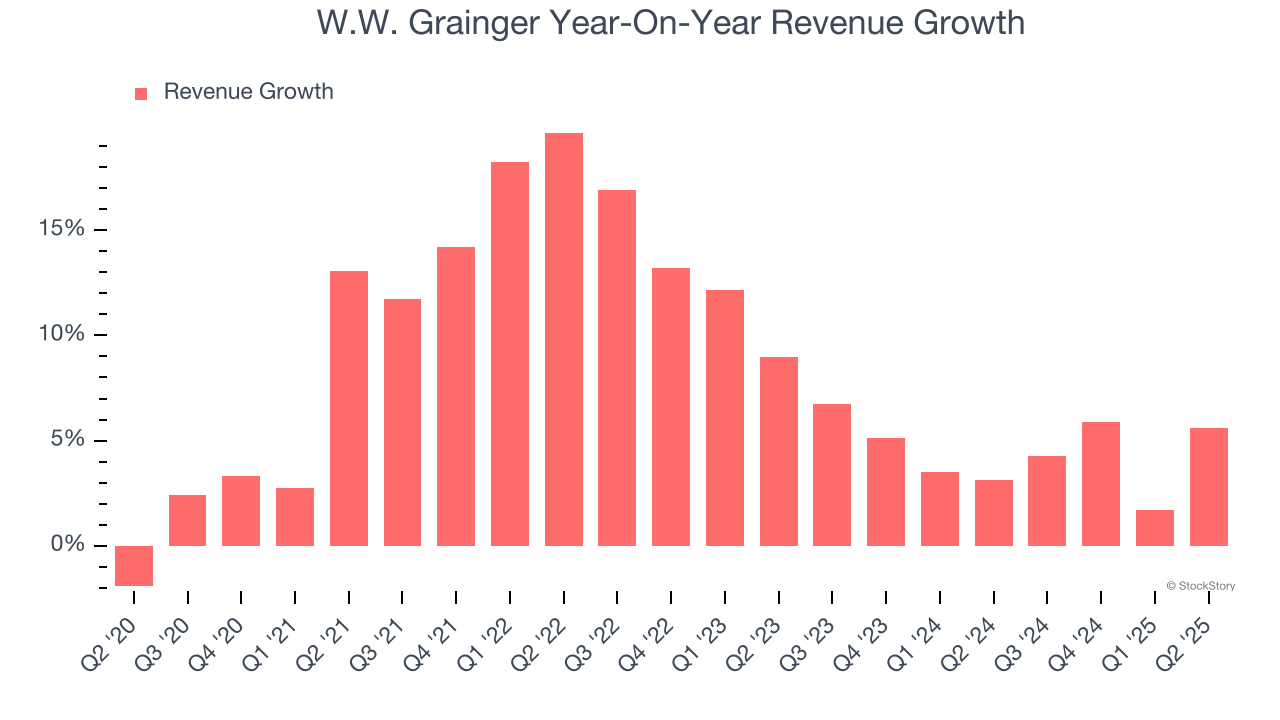
We can better understand the company’s sales dynamics by analyzing its organic revenue, which strips out one-time events like acquisitions and currency fluctuations that don’t accurately reflect its fundamentals. Over the last two years, W.W. Grainger’s organic revenue averaged 5.3% year-on-year growth. Because this number aligns with its two-year revenue growth, we can see the company’s core operations (not acquisitions and divestitures) drove most of its results. 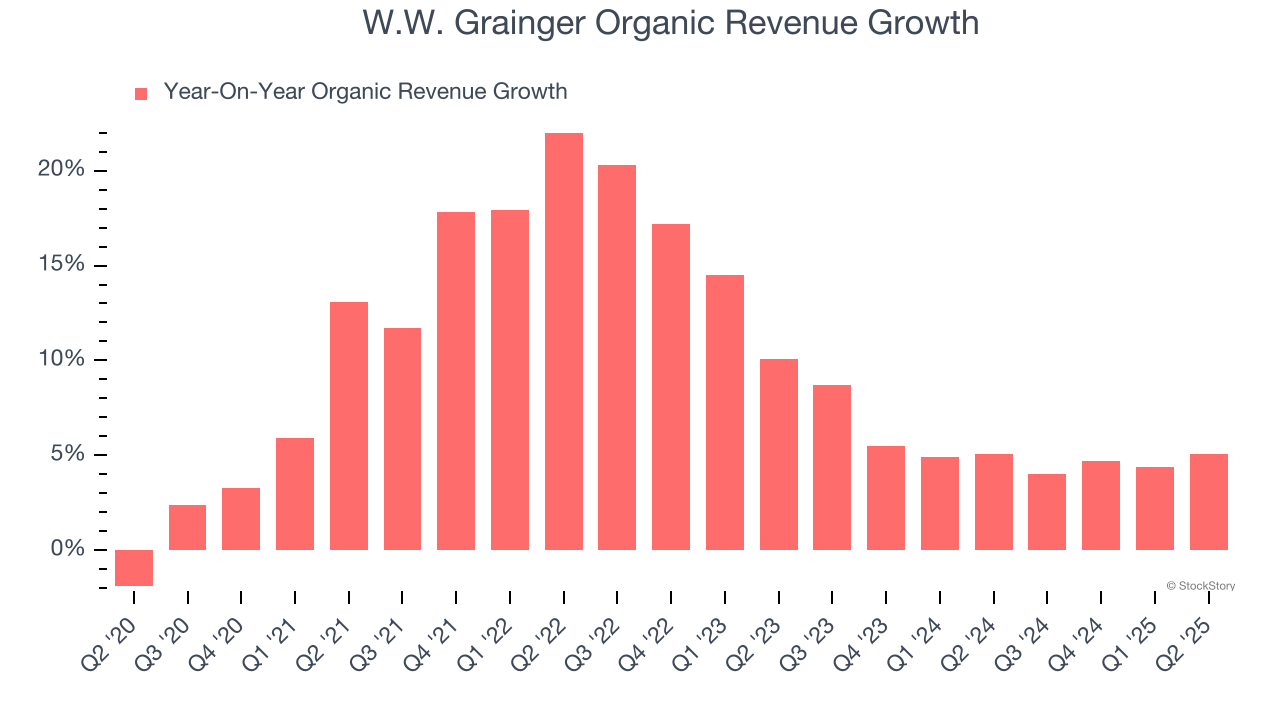
This quarter, W.W. Grainger reported year-on-year revenue growth of 5.6%, and its $4.55 billion of revenue exceeded Wall Street’s estimates by 0.6%.
Looking ahead, sell-side analysts expect revenue to grow 6% over the next 12 months, similar to its two-year rate. While this projection suggests its newer products and services will spur better top-line performance, it is still below the sector average. At least the company is tracking well in other measures of financial health.
Today’s young investors won’t have read the timeless lessons in Gorilla Game: Picking Winners In High Technology because it was written more than 20 years ago when Microsoft and Apple were first establishing their supremacy. But if we apply the same principles, then enterprise software stocks leveraging their own generative AI capabilities may well be the Gorillas of the future. So, in that spirit, we are excited to present our Special Free Report on a profitable, fast-growing enterprise software stock that is already riding the automation wave and looking to catch the generative AI next.
Operating Margin
Operating margin is one of the best measures of profitability because it tells us how much money a company takes home after procuring and manufacturing its products, marketing and selling those products, and most importantly, keeping them relevant through research and development.
W.W. Grainger has been an efficient company over the last five years. It was one of the more profitable businesses in the industrials sector, boasting an average operating margin of 14.3%. This result isn’t surprising as its high gross margin gives it a favorable starting point.
Analyzing the trend in its profitability, W.W. Grainger’s operating margin rose by 4.3 percentage points over the last five years, as its sales growth gave it operating leverage.
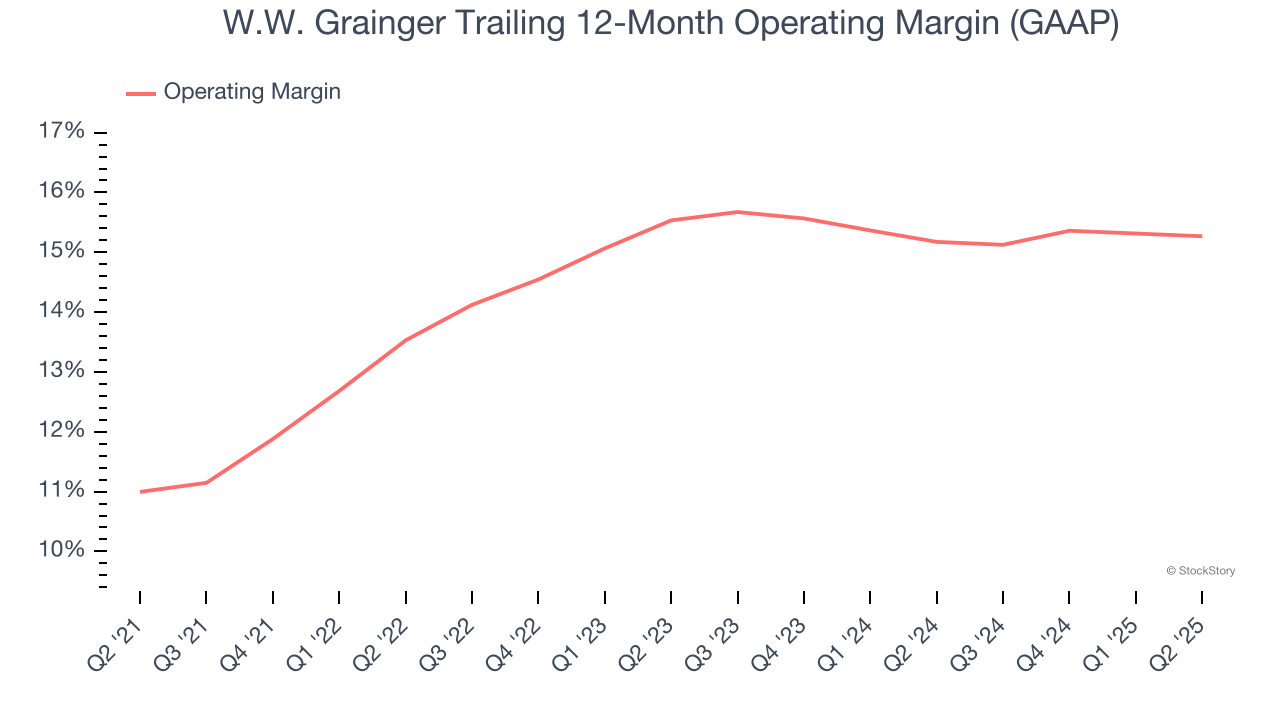
In Q2, W.W. Grainger generated an operating margin profit margin of 14.9%, in line with the same quarter last year. This indicates the company’s cost structure has recently been stable.
Earnings Per Share
We track the long-term change in earnings per share (EPS) for the same reason as long-term revenue growth. Compared to revenue, however, EPS highlights whether a company’s growth is profitable.
W.W. Grainger’s EPS grew at an astounding 28.1% compounded annual growth rate over the last five years, higher than its 8.5% annualized revenue growth. This tells us the company became more profitable on a per-share basis as it expanded.
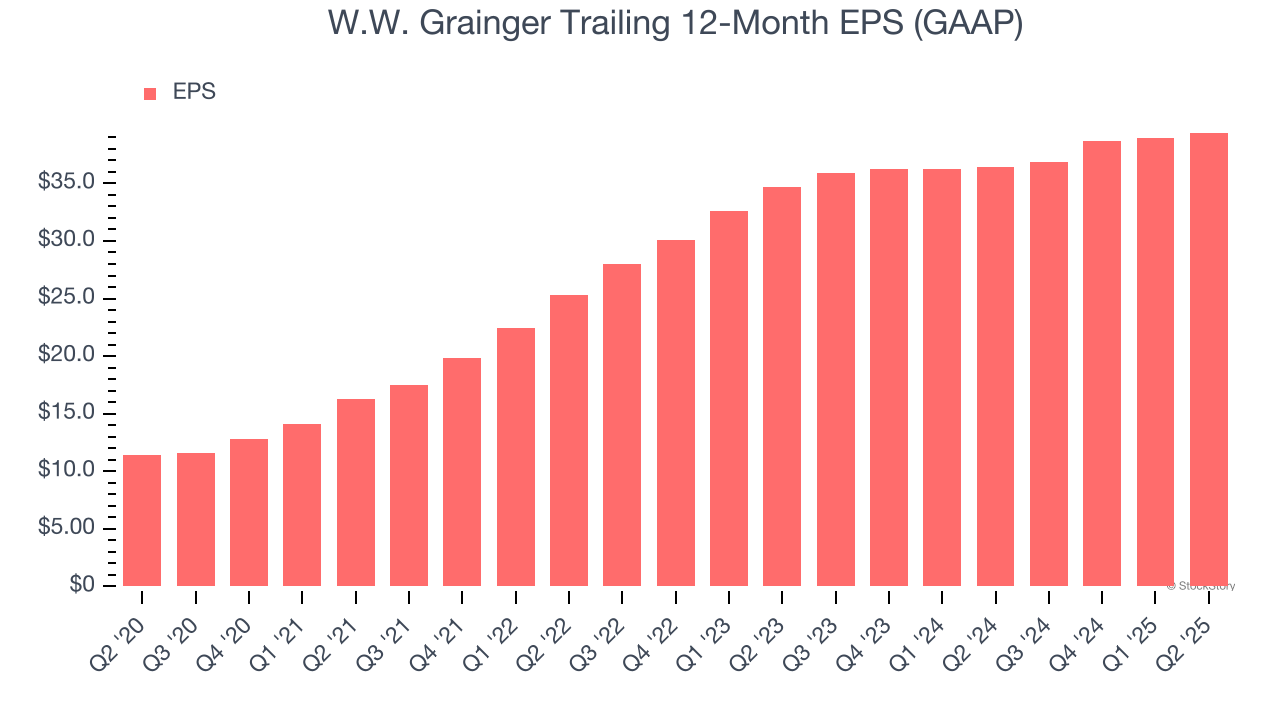
Diving into the nuances of W.W. Grainger’s earnings can give us a better understanding of its performance. As we mentioned earlier, W.W. Grainger’s operating margin was flat this quarter but expanded by 4.3 percentage points over the last five years. On top of that, its share count shrank by 10.4%. These are positive signs for shareholders because improving profitability and share buybacks turbocharge EPS growth relative to revenue growth. 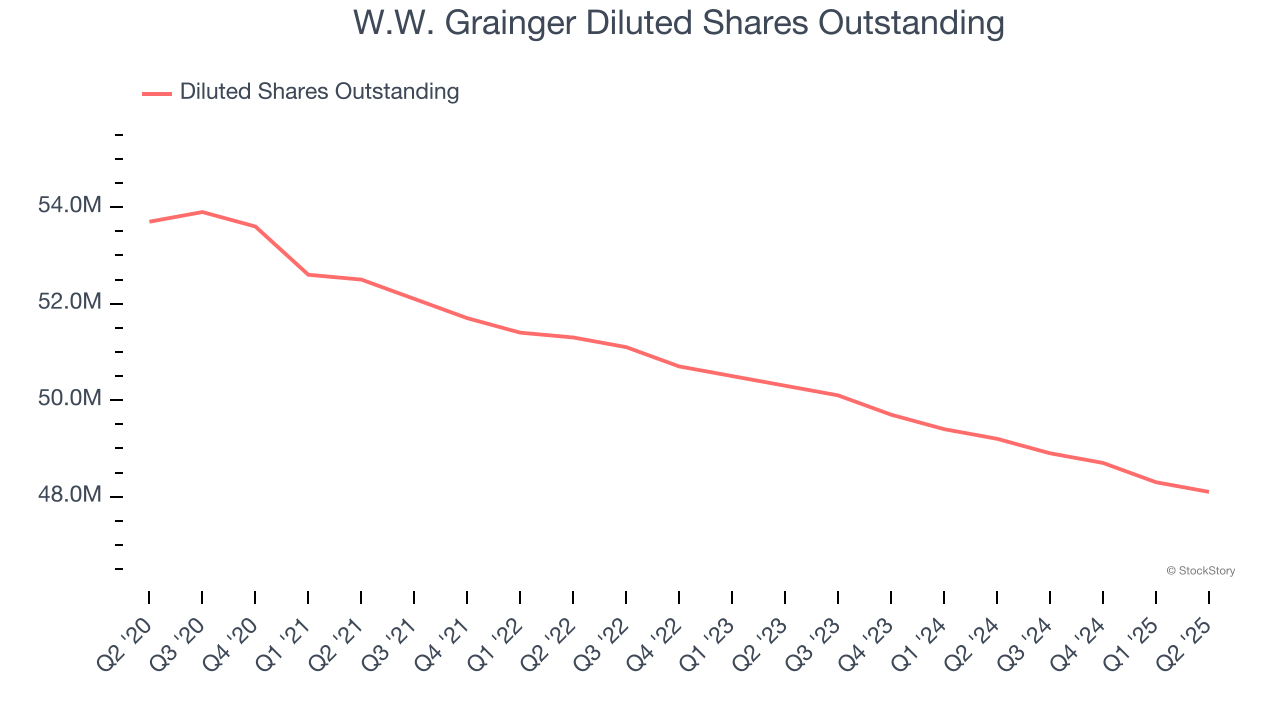
Like with revenue, we analyze EPS over a more recent period because it can provide insight into an emerging theme or development for the business.
For W.W. Grainger, its two-year annual EPS growth of 6.6% was lower than its five-year trend. This wasn’t great, but at least the company was successful in other measures of financial health.
In Q2, W.W. Grainger reported EPS at $9.97, up from $9.51 in the same quarter last year. This print was close to analysts’ estimates. Over the next 12 months, Wall Street expects W.W. Grainger’s full-year EPS of $39.41 to grow 8.5%.
Key Takeaways from W.W. Grainger’s Q2 Results
It was encouraging to see W.W. Grainger beat analysts’ EBITDA expectations this quarter. We were also happy its revenue narrowly outperformed Wall Street’s estimates. On the other hand, its full-year EPS guidance slightly missed and its EPS fell slightly short of Wall Street’s estimates. Overall, this quarter could have been better. The stock traded down 11.2% to $923 immediately after reporting.
Big picture, is W.W. Grainger a buy here and now? If you’re making that decision, you should consider the bigger picture of valuation, business qualities, as well as the latest earnings. We cover that in our actionable full research report which you can read here, it’s free.


