
Safety and specialty services provider APi (NYSE: APG) reported Q2 CY2025 results beating Wall Street’s revenue expectations, with sales up 15% year on year to $1.99 billion. On top of that, next quarter’s revenue guidance ($2.01 billion at the midpoint) was surprisingly good and 4.6% above what analysts were expecting. Its non-GAAP profit of $0.39 per share was 4.2% above analysts’ consensus estimates.
Is now the time to buy APi? Find out by accessing our full research report, it’s free.
APi (APG) Q2 CY2025 Highlights:
- Revenue: $1.99 billion vs analyst estimates of $1.89 billion (15% year-on-year growth, 5.1% beat)
- Adjusted EPS: $0.39 vs analyst estimates of $0.37 (4.2% beat)
- Adjusted EBITDA: $272 million vs analyst estimates of $264.9 million (13.7% margin, 2.7% beat)
- The company lifted its revenue guidance for the full year to $7.75 billion at the midpoint from $7.5 billion, a 3.3% increase
- EBITDA guidance for the full year is $1.03 billion at the midpoint, above analyst estimates of $1.01 billion
- Operating Margin: 7.2%, in line with the same quarter last year
- Free Cash Flow Margin: 2.8%, down from 5.1% in the same quarter last year
- Organic Revenue rose 8.3% year on year (-3.1% in the same quarter last year)
- Market Capitalization: $14.29 billion
Company Overview
Started in 1926 as an insulation contractor, APi (NYSE: APG) provides life safety solutions and specialty services for buildings and infrastructure.
Revenue Growth
A company’s long-term performance is an indicator of its overall quality. Any business can experience short-term success, but top-performing ones enjoy sustained growth for years. Over the last five years, APi grew its sales at an incredible 15.2% compounded annual growth rate. Its growth beat the average industrials company and shows its offerings resonate with customers.
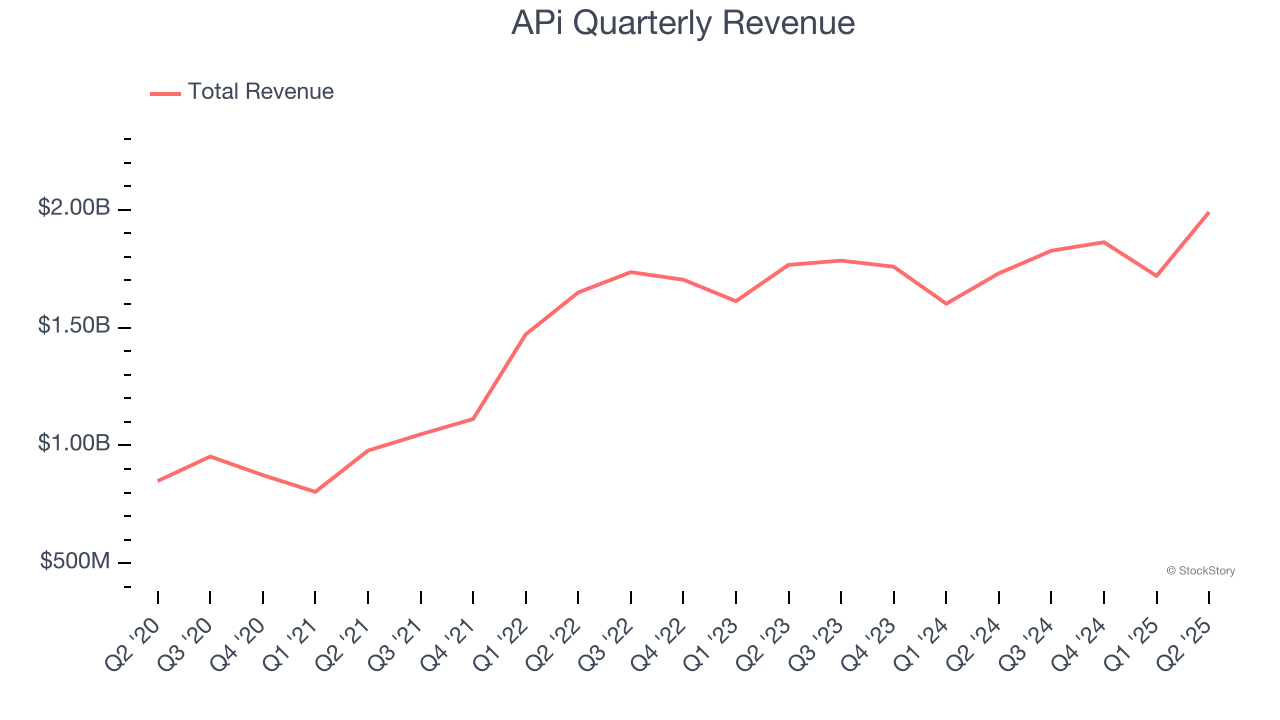
Long-term growth is the most important, but within industrials, a half-decade historical view may miss new industry trends or demand cycles. APi’s recent performance shows its demand has slowed significantly as its annualized revenue growth of 4.2% over the last two years was well below its five-year trend. 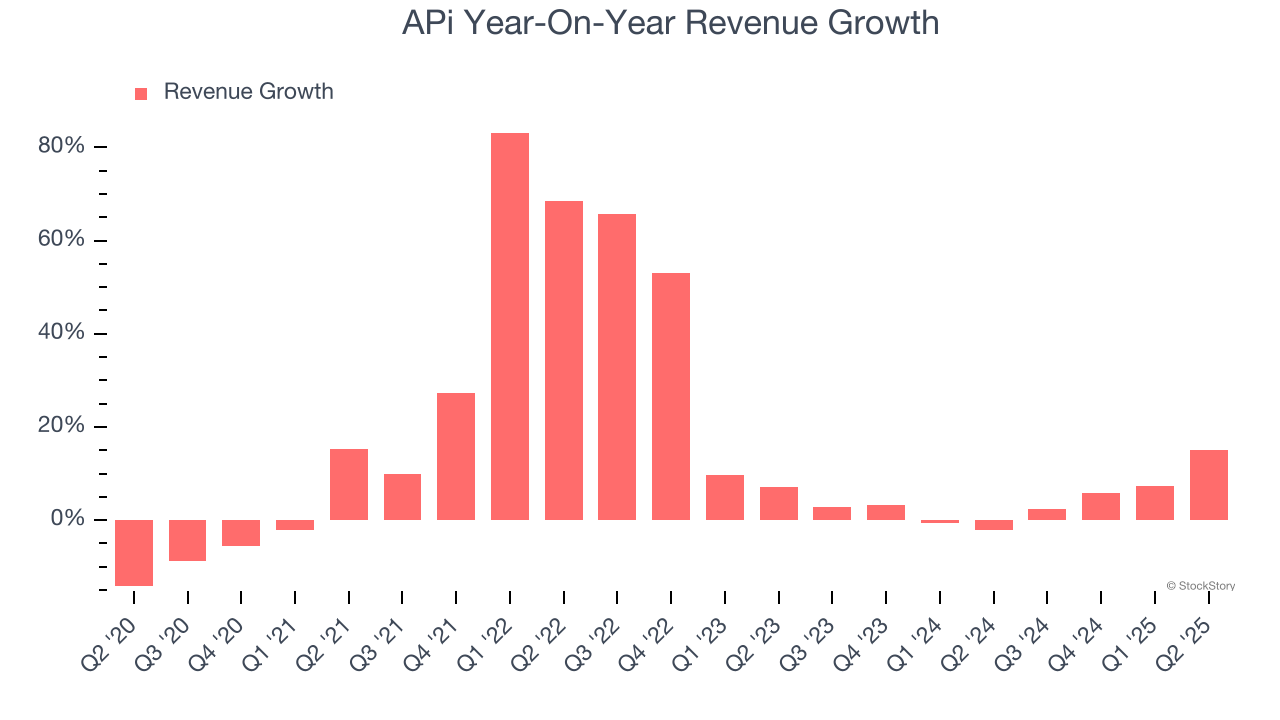
We can better understand the company’s sales dynamics by analyzing its organic revenue, which strips out one-time events like acquisitions and currency fluctuations that don’t accurately reflect its fundamentals. Over the last two years, APi’s organic revenue averaged 1.2% year-on-year growth. Because this number is lower than its normal revenue growth, we can see that some mixture of acquisitions and foreign exchange rates boosted its headline results. 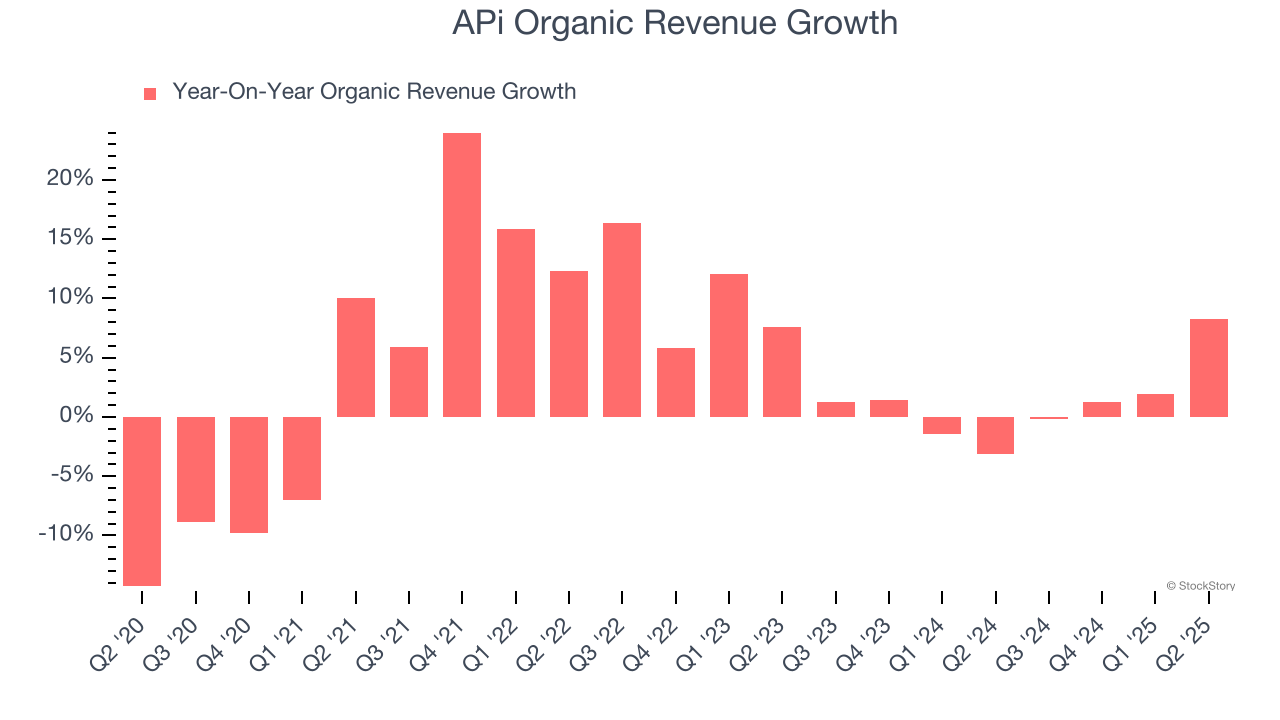
This quarter, APi reported year-on-year revenue growth of 15%, and its $1.99 billion of revenue exceeded Wall Street’s estimates by 5.1%. Company management is currently guiding for a 10.1% year-on-year increase in sales next quarter.
Looking further ahead, sell-side analysts expect revenue to grow 5% over the next 12 months, similar to its two-year rate. This projection is underwhelming and implies its newer products and services will not accelerate its top-line performance yet.
Today’s young investors won’t have read the timeless lessons in Gorilla Game: Picking Winners In High Technology because it was written more than 20 years ago when Microsoft and Apple were first establishing their supremacy. But if we apply the same principles, then enterprise software stocks leveraging their own generative AI capabilities may well be the Gorillas of the future. So, in that spirit, we are excited to present our Special Free Report on a profitable, fast-growing enterprise software stock that is already riding the automation wave and looking to catch the generative AI next.
Operating Margin
APi was profitable over the last five years but held back by its large cost base. Its average operating margin of 4.7% was weak for an industrials business. This result isn’t too surprising given its low gross margin as a starting point.
On the plus side, APi’s operating margin rose by 4.2 percentage points over the last five years, as its sales growth gave it operating leverage.
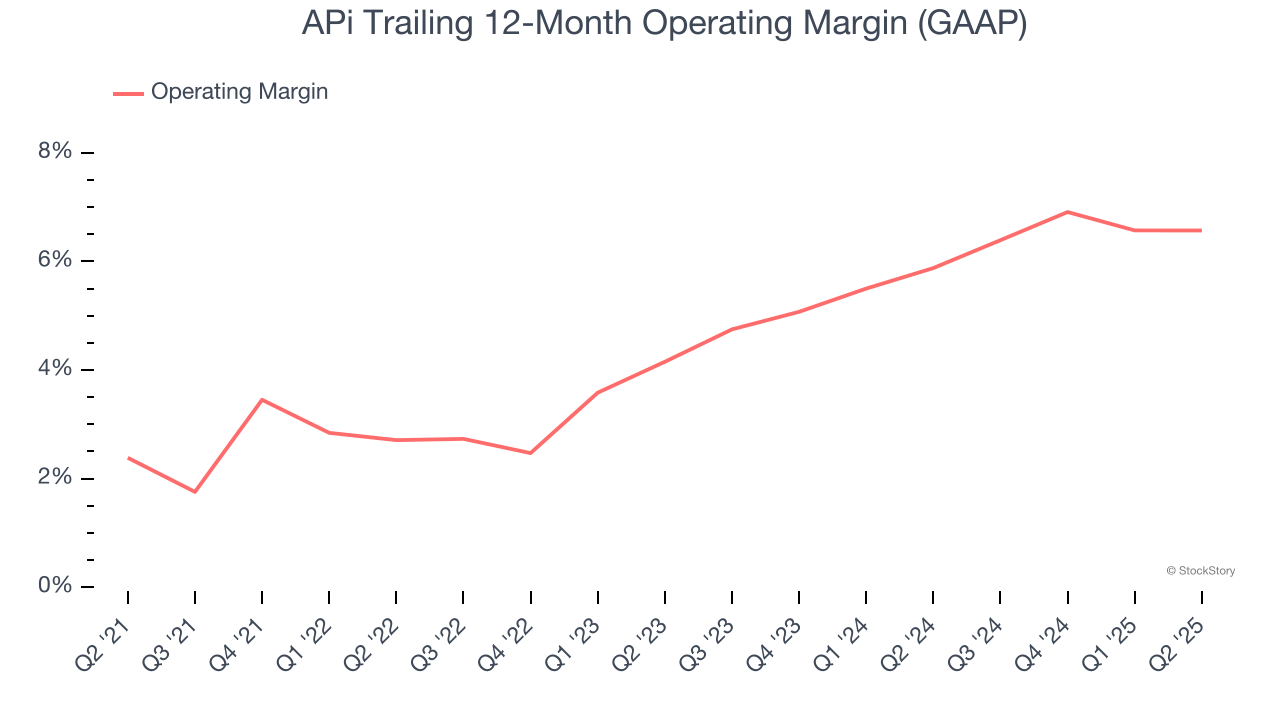
In Q2, APi generated an operating margin profit margin of 7.2%, in line with the same quarter last year. This indicates the company’s cost structure has recently been stable.
Earnings Per Share
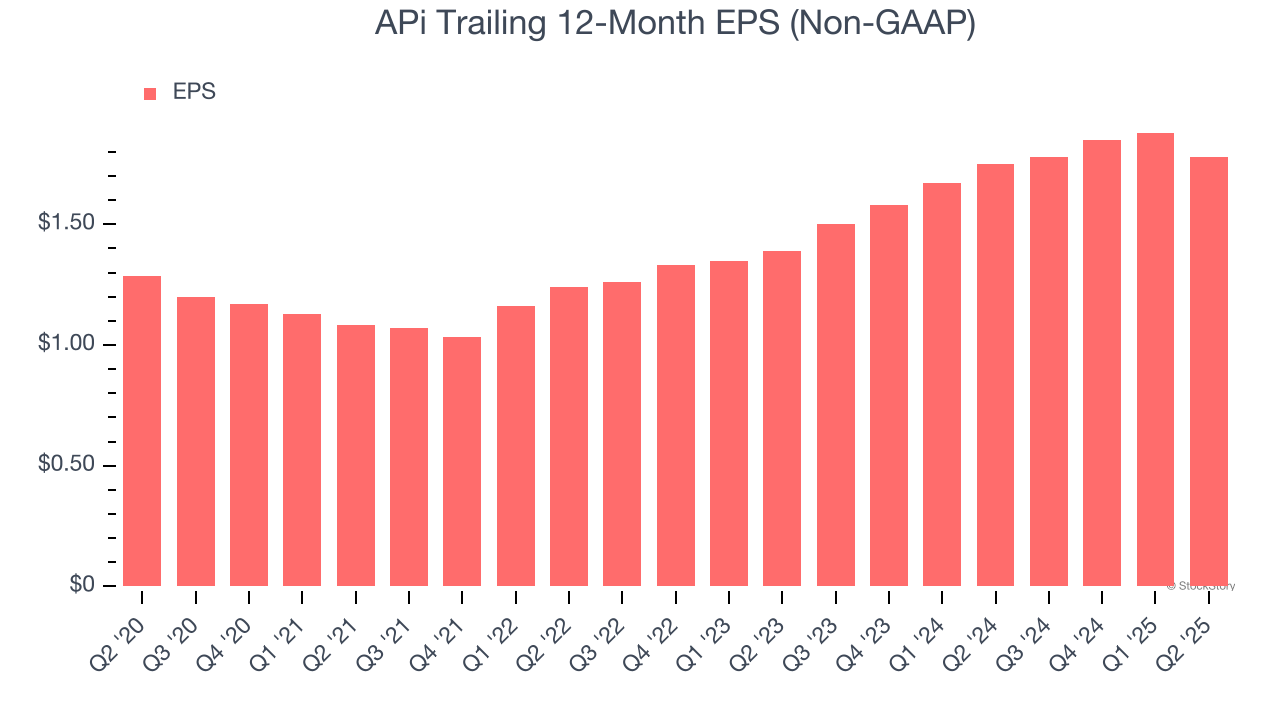
We track the long-term change in earnings per share (EPS) for the same reason as long-term revenue growth. Compared to revenue, however, EPS highlights whether a company’s growth is profitable.
APi’s EPS grew at an unimpressive 6.7% compounded annual growth rate over the last five years, lower than its 15.2% annualized revenue growth. However, its operating margin actually improved during this time, telling us that non-fundamental factors such as interest expenses and taxes affected its ultimate earnings.
We can take a deeper look into APi’s earnings to better understand the drivers of its performance. A five-year view shows APi has diluted its shareholders, growing its share count by 62.1%. This dilution overshadowed its increased operating efficiency and has led to lower per share earnings. Taxes and interest expenses can also affect EPS but don’t tell us as much about a company’s fundamentals. 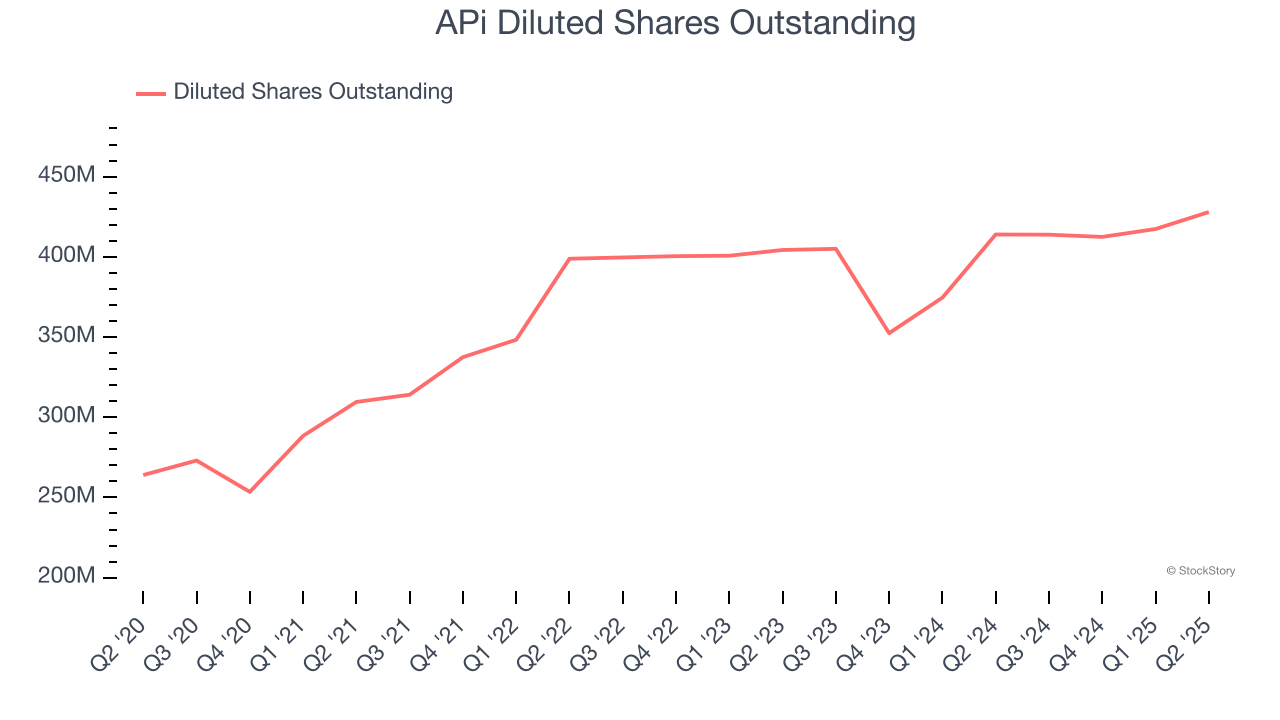
Like with revenue, we analyze EPS over a more recent period because it can provide insight into an emerging theme or development for the business.
For APi, its two-year annual EPS growth of 13.2% was higher than its five-year trend. This acceleration made it one of the faster-growing industrials companies in recent history.
In Q2, APi reported EPS at $0.39, down from $0.49 in the same quarter last year. Despite falling year on year, this print beat analysts’ estimates by 4.2%. Over the next 12 months, Wall Street expects APi’s full-year EPS of $1.78 to shrink by 16.2%.
Key Takeaways from APi’s Q2 Results
We were impressed by how APi beat analysts’ organic revenue, EPS, and EBITDA expectations this quarter. We were also excited it raised its full-year revenue and EBITDA guidance. Zooming out, we think this quarter featured some important positives. The stock traded up 5.1% to $36.21 immediately after reporting.
Sure, APi had a solid quarter, but if we look at the bigger picture, is this stock a buy? What happened in the latest quarter matters, but not as much as longer-term business quality and valuation, when deciding whether to invest in this stock. We cover that in our actionable full research report which you can read here, it’s free.


