
Regional banking company Flagstar Financial (NYSE: FLG) missed Wall Street’s revenue expectations in Q2 CY2025, with sales falling 26.1% year on year to $496 million. Its non-GAAP loss of $0.14 per share was in line with analysts’ consensus estimates.
Is now the time to buy Flagstar Financial? Find out by accessing our full research report, it’s free.
Flagstar Financial (FLG) Q2 CY2025 Highlights:
- Net Interest Income: $419 million vs analyst estimates of $440 million (24.8% year-on-year decline, 4.8% miss)
- Net Interest Margin: 1.8% vs analyst estimates of 1.9% (17 basis point year-on-year decrease, 7.3 bps miss)
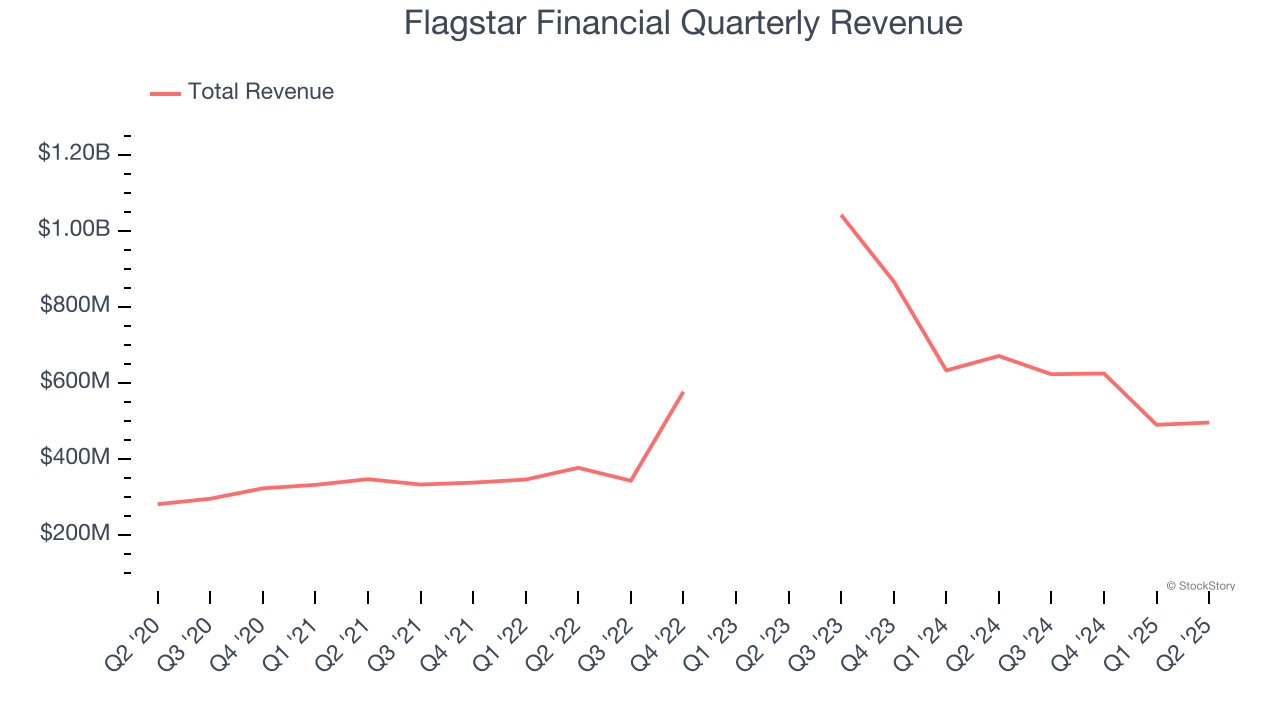
- Revenue: $496 million vs analyst estimates of $519.9 million (26.1% year-on-year decline, 4.6% miss)
- Efficiency Ratio: 103% vs analyst estimates of 97.5% (5.8 percentage point miss)
- Adjusted EPS: -$0.14 vs analyst estimates of -$0.13 (in line)
- Market Capitalization: $5.00 billion
Chief Executive Officer Joseph M. Otting stated, "I am very pleased with the progress the Company made during the second quarter across multiple fronts as we continued to execute on our successful strategy of transforming Flagstar into a top-performing, well-diversified regional bank. We made further gains on our C&I and Private Bank growth strategy, our credit quality metrics continue to improve, we continued to lower our operating expenses, reduced our commercial real estate exposure, and we also increased our net interest margin. As a result, our earnings profile during the quarter improved, as the second quarter net loss narrowed significantly compared to both the second quarter of last year and the first quarter of this year, while our net revenues, pre-provision for loan losses, turned positive during the quarter. This bodes well for our expected return to profitability in the fourth quarter of this year."
Company Overview
Tracing its roots back to 1859 and rebranded from New York Community Bancorp in 2024, Flagstar Financial (NYSE: FLG) is a bank holding company that offers commercial and consumer banking services, with specialties in multi-family lending, mortgage originations, and warehouse lending.
Sales Growth
In general, banks make money from two primary sources. The first is net interest income, which is interest earned on loans, mortgages, and investments in securities minus interest paid out on deposits. The second source is non-interest income, which can come from bank account, credit card, wealth management, investing banking, and trading fees.
Thankfully, Flagstar Financial’s 16% annualized revenue growth over the last five years was incredible. Its growth beat the average bank company and shows its offerings resonate with customers.
 Note: Quarters not shown were determined to be outliers, impacted by outsized investment gains/losses that are not indicative of the recurring fundamentals of the business.
We at StockStory place the most emphasis on long-term growth, but within financials, a half-decade historical view may miss recent interest rate changes, market returns, and industry trends. Flagstar Financial’s recent performance marks a sharp pivot from its five-year trend as its revenue has shown annualized declines of 9.3% over the last two years. 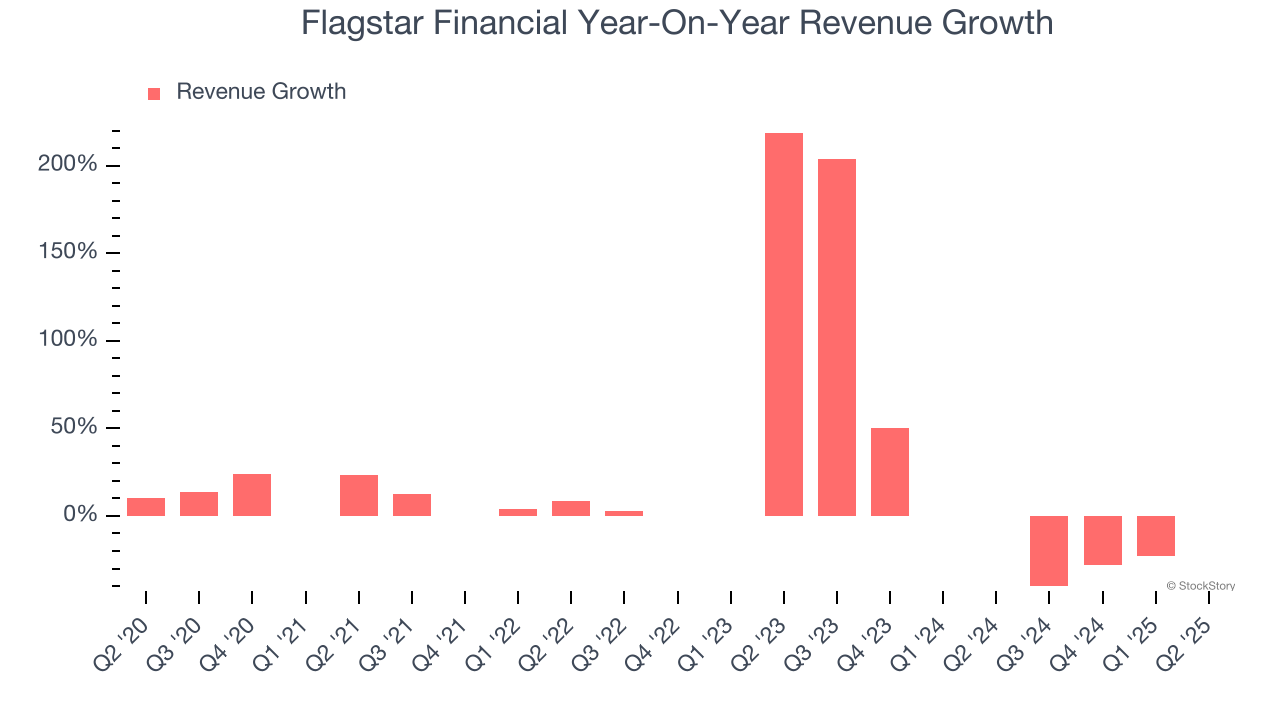 Note: Quarters not shown were determined to be outliers, impacted by outsized investment gains/losses that are not indicative of the recurring fundamentals of the business.
This quarter, Flagstar Financial missed Wall Street’s estimates and reported a rather uninspiring 26.1% year-on-year revenue decline, generating $496 million of revenue.
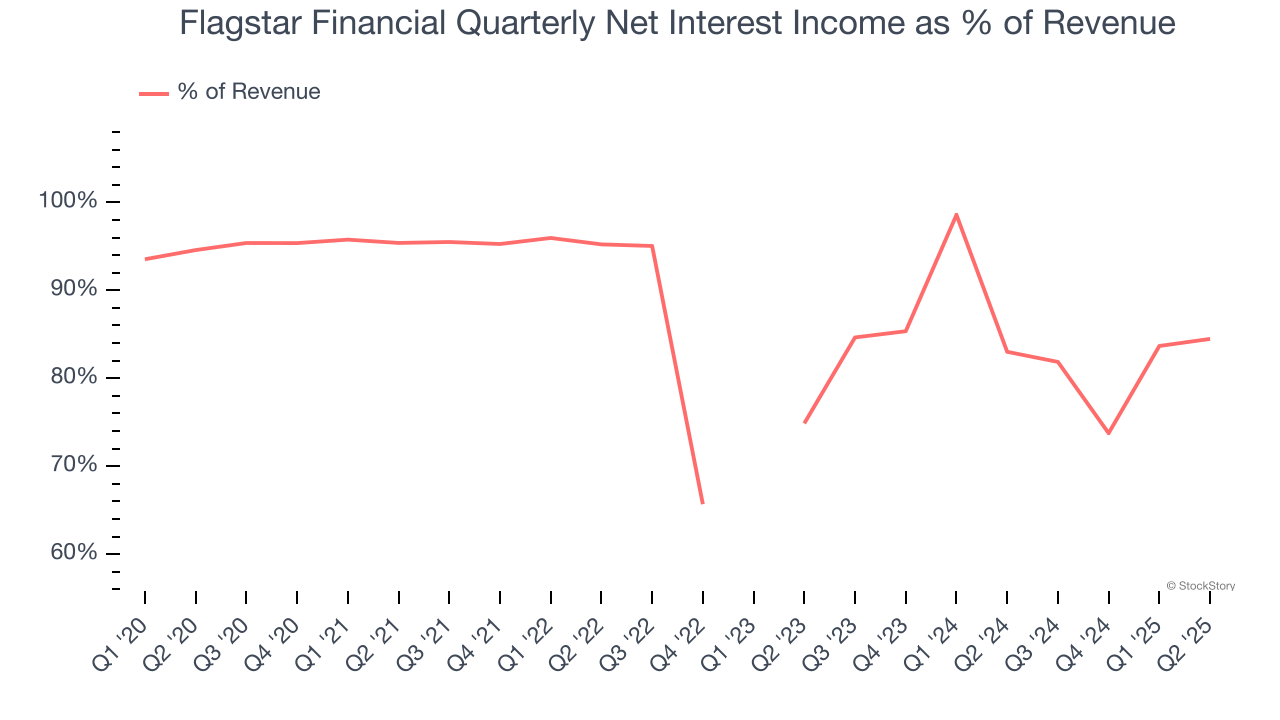
Net interest income made up 84.8% of the company’s total revenue during the last five years, meaning Flagstar Financial barely relies on non-interest income to drive its overall growth.
 Note: Quarters not shown were determined to be outliers, impacted by outsized investment gains/losses that are not indicative of the recurring fundamentals of the business.
Markets consistently prioritize net interest income growth over fee-based revenue, recognizing its superior quality and recurring nature compared to the more unpredictable non-interest income streams.
Here at StockStory, we certainly understand the potential of thematic investing. Diverse winners from Microsoft (MSFT) to Alphabet (GOOG), Coca-Cola (KO) to Monster Beverage (MNST) could all have been identified as promising growth stories with a megatrend driving the growth. So, in that spirit, we’ve identified a relatively under-the-radar profitable growth stock benefiting from the rise of AI, available to you FREE via this link.
Tangible Book Value Per Share (TBVPS)
Banks are balance sheet-driven businesses because they generate earnings primarily through borrowing and lending. They’re also valued based on their balance sheet strength and ability to compound book value (another name for shareholders’ equity) over time.
Because of this, tangible book value per share (TBVPS) emerges as the critical performance benchmark. By excluding intangible assets with uncertain liquidation values, this metric captures real, liquid net worth per share. On the other hand, EPS is often distorted by mergers and flexible loan loss accounting. TBVPS provides clearer performance insights.
Flagstar Financial’s TBVPS declined at a 6.7% annual clip over the last five years. A turnaround doesn’t seem to be in sight as its TBVPS also dropped by 25.3% annually over the last two years ($30.87 to $17.24 per share).
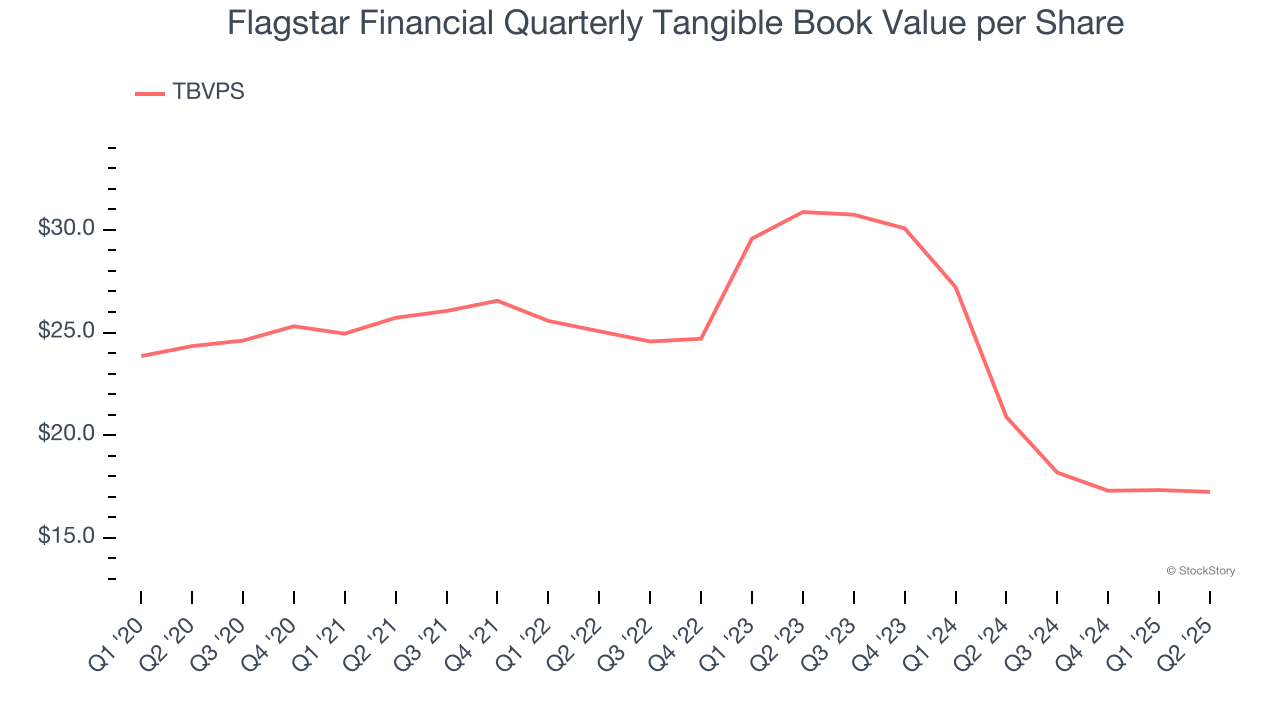
Over the next 12 months, Consensus estimates call for Flagstar Financial’s TBVPS to shrink by 4.3% to $16.50, a sour projection.
Key Takeaways from Flagstar Financial’s Q2 Results
We struggled to find many positives in these results. Its revenue missed and its net interest income fell short of Wall Street’s estimates. Overall, this was a softer quarter. The stock traded up 2.2% to $12.30 immediately after reporting.
Is Flagstar Financial an attractive investment opportunity at the current price? What happened in the latest quarter matters, but not as much as longer-term business quality and valuation, when deciding whether to invest in this stock. We cover that in our actionable full research report which you can read here, it’s free.


