
Children’s apparel manufacturer Carter’s (NYSE: CRI) beat Wall Street’s revenue expectations in Q2 CY2025, with sales up 3.7% year on year to $585.3 million. Its non-GAAP profit of $0.17 per share was 54.6% below analysts’ consensus estimates.
Is now the time to buy Carter's? Find out by accessing our full research report, it’s free.
Carter's (CRI) Q2 CY2025 Highlights:
- Revenue: $585.3 million vs analyst estimates of $566.3 million (3.7% year-on-year growth, 3.4% beat)
- Adjusted EPS: $0.17 vs analyst expectations of $0.37 (54.6% miss)
- Adjusted EBITDA: $26.5 million vs analyst estimates of $39.95 million (4.5% margin, 33.7% miss)
- Operating Margin: 0.7%, down from 7% in the same quarter last year
- Free Cash Flow Margin: 4.1%, down from 18.6% in the same quarter last year
- Same-Store Sales rose 2.2% year on year (-11.8% in the same quarter last year)
- Market Capitalization: $1.19 billion
“Our second quarter sales performance showed stabilization and momentum, particularly in our direct-to-consumer businesses, which achieved comparable sales growth in the U.S., Canada, and Mexico,” said Douglas C. Palladini, Chief Executive Officer & President.
Company Overview
Rumored to sell more than 10 products for every child born in the United States, Carter's (NYSE: CRI) is an American designer and marketer of children's apparel.
Revenue Growth
A company’s long-term sales performance can indicate its overall quality. Any business can put up a good quarter or two, but many enduring ones grow for years. Carter’s demand was weak over the last five years as its sales fell at a 2.5% annual rate. This was below our standards and is a sign of poor business quality.
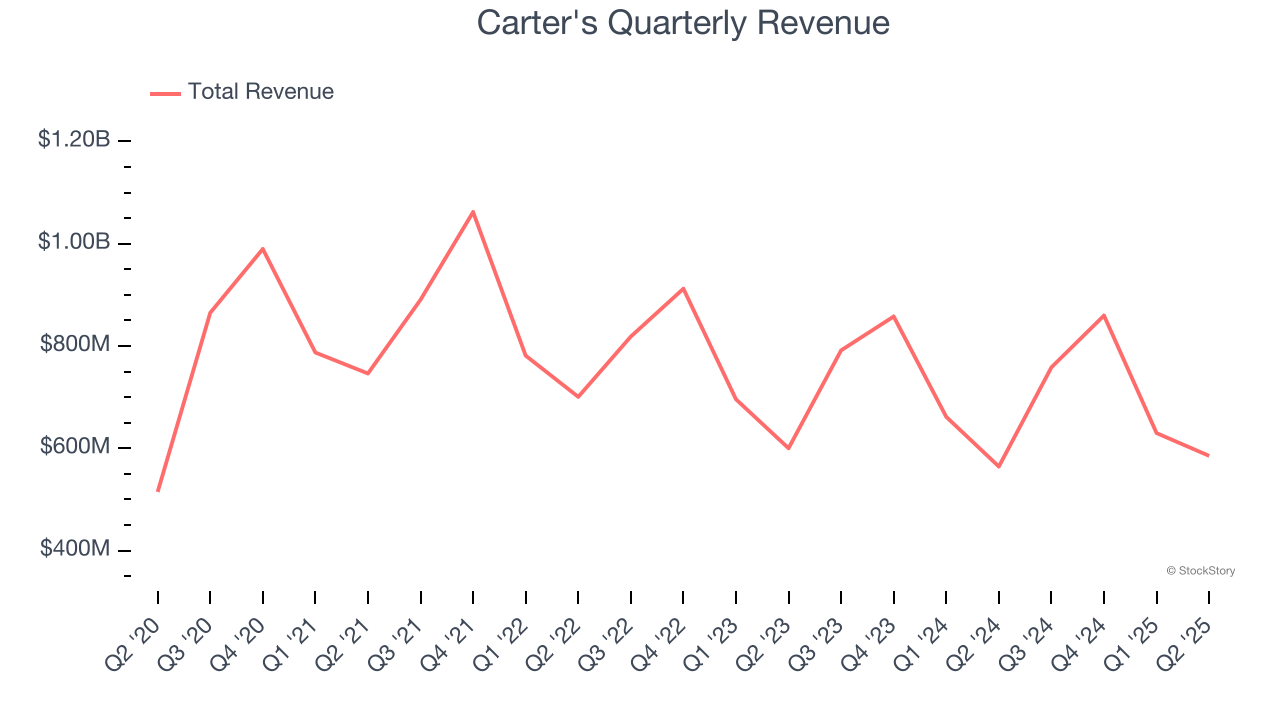
Long-term growth is the most important, but within consumer discretionary, product cycles are short and revenue can be hit-driven due to rapidly changing trends and consumer preferences. Carter’s annualized revenue declines of 3.2% over the last two years align with its five-year trend, suggesting its demand has consistently shrunk. 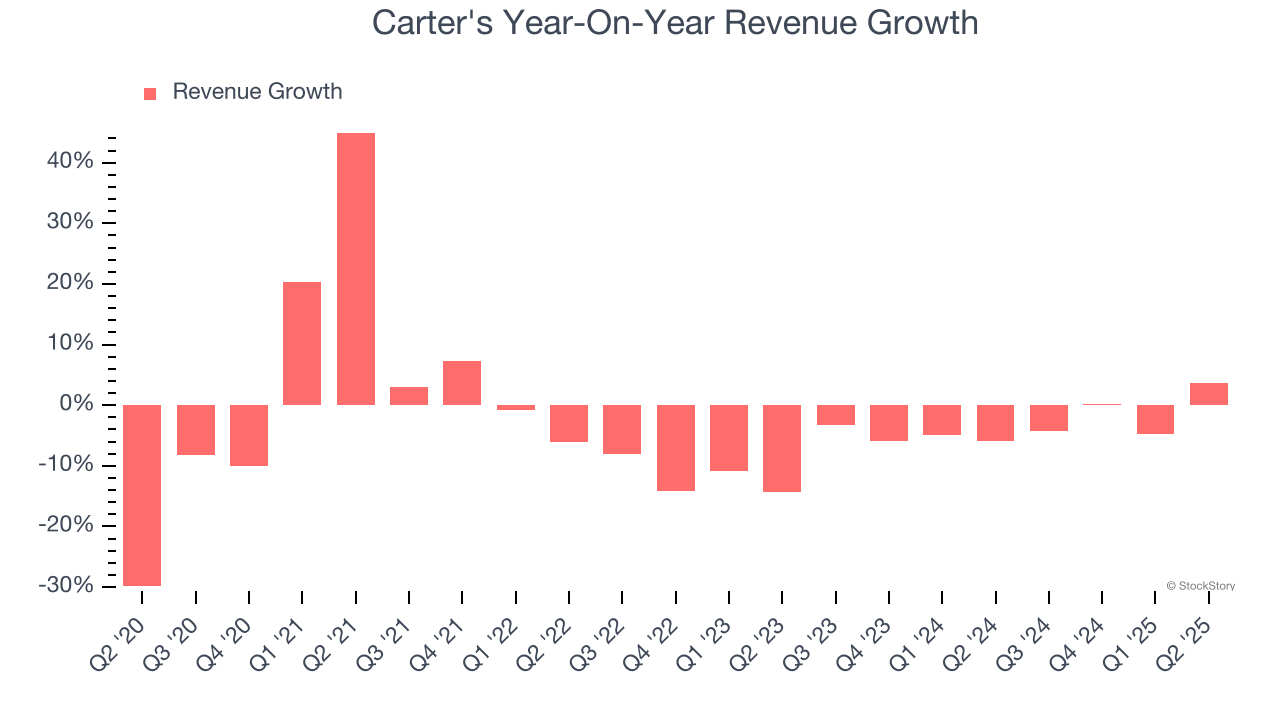
Carter's also reports same-store sales, which show how much revenue its established locations generate. Over the last two years, Carter’s same-store sales averaged 6.6% year-on-year declines. Because this number is lower than its revenue growth, we can see the opening of new locations is boosting the company’s top-line performance. 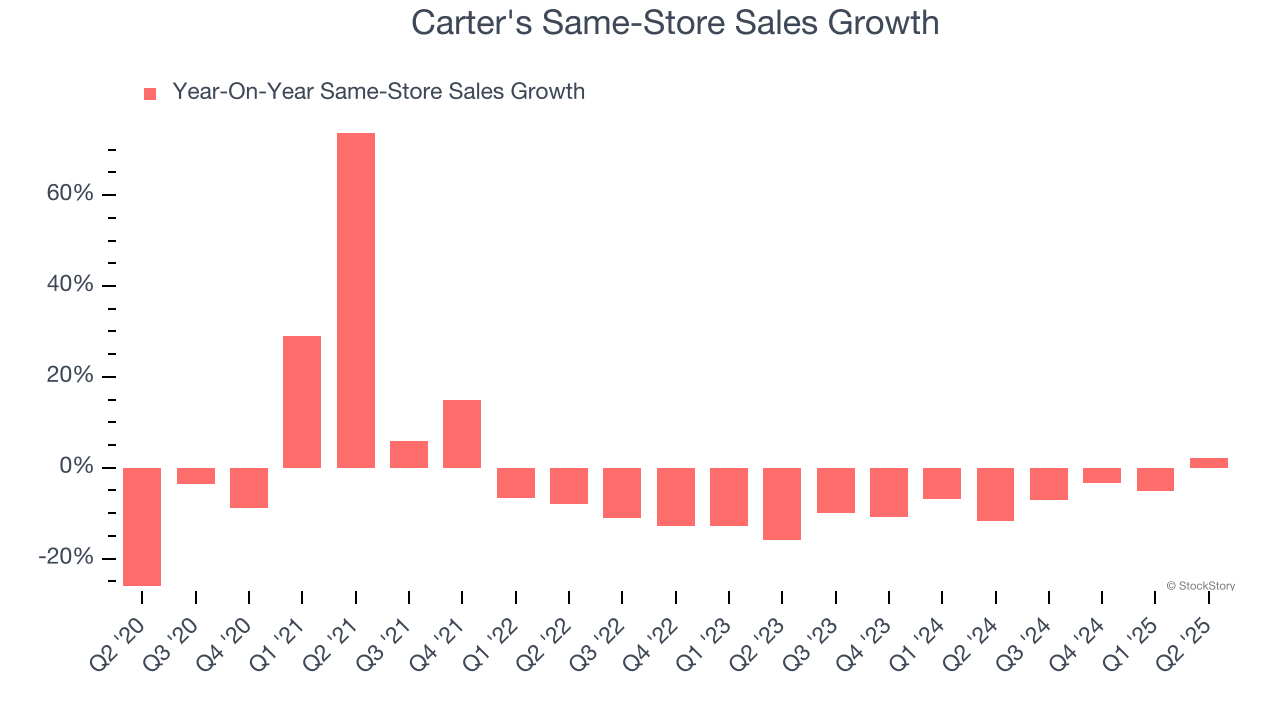
This quarter, Carter's reported modest year-on-year revenue growth of 3.7% but beat Wall Street’s estimates by 3.4%.
Looking ahead, sell-side analysts expect revenue to decline by 1.2% over the next 12 months. Although this projection is better than its two-year trend, it’s hard to get excited about a company that is struggling with demand.
Today’s young investors won’t have read the timeless lessons in Gorilla Game: Picking Winners In High Technology because it was written more than 20 years ago when Microsoft and Apple were first establishing their supremacy. But if we apply the same principles, then enterprise software stocks leveraging their own generative AI capabilities may well be the Gorillas of the future. So, in that spirit, we are excited to present our Special Free Report on a profitable, fast-growing enterprise software stock that is already riding the automation wave and looking to catch the generative AI next.
Operating Margin
Carter’s operating margin has shrunk over the last 12 months and averaged 9% over the last two years. The company’s profitability was mediocre for a consumer discretionary business and shows it couldn’t pass its higher operating expenses onto its customers.
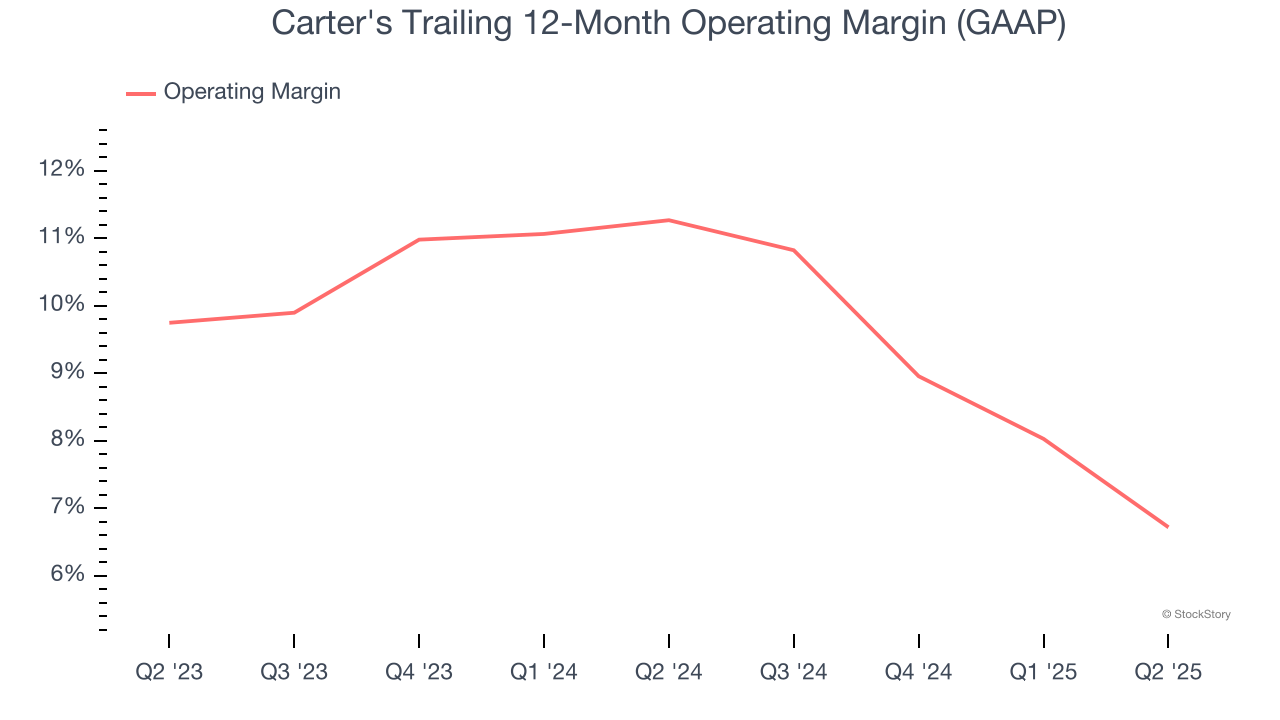
This quarter, Carter’s breakeven margin was down 6.3 percentage points year on year. This contraction shows it was less efficient because its expenses grew faster than its revenue.
Earnings Per Share
We track the long-term change in earnings per share (EPS) for the same reason as long-term revenue growth. Compared to revenue, however, EPS highlights whether a company’s growth is profitable.
Carter’s EPS grew at a weak 2% compounded annual growth rate over the last five years. This performance was better than its 2.5% annualized revenue declines but doesn’t tell us much about its business quality because its operating margin didn’t improve.

In Q2, Carter's reported EPS at $0.17, down from $0.76 in the same quarter last year. This print missed analysts’ estimates. Over the next 12 months, Wall Street expects Carter’s full-year EPS of $4.86 to shrink by 46.3%.
Key Takeaways from Carter’s Q2 Results
We were impressed by how significantly Carter's blew past analysts’ same-store sales expectations this quarter. We were also happy its revenue outperformed Wall Street’s estimates. On the other hand, its EBITDA missed and its EPS fell short of Wall Street’s estimates. Overall, this quarter could have been better. The stock traded down 3.8% to $31.49 immediately following the results.
Carter's underperformed this quarter, but does that create an opportunity to invest right now? When making that decision, it’s important to consider its valuation, business qualities, as well as what has happened in the latest quarter. We cover that in our actionable full research report which you can read here, it’s free.


