
Global airline American Airlines (NASDAQ: AAL) reported Q2 CY2025 results topping the market’s revenue expectations, but sales were flat year on year at $14.39 billion. Its non-GAAP profit of $0.95 per share was 23% above analysts’ consensus estimates.
Is now the time to buy American Airlines? Find out by accessing our full research report, it’s free.
American Airlines (AAL) Q2 CY2025 Highlights:
- Revenue: $14.39 billion vs analyst estimates of $14.3 billion (flat year on year, 0.6% beat)
- Adjusted EPS: $0.95 vs analyst estimates of $0.77 (23% beat)
- Adjusted EPS guidance for the full year is $0.50 at the midpoint, missing analyst estimates by 34.5%
- Operating Margin: 7.9%, down from 9.7% in the same quarter last year
- Free Cash Flow Margin: 3.2%, similar to the same quarter last year
- Revenue Passenger Miles: 65.76 billion, in line with the same quarter last year
- Market Capitalization: $8.36 billion
“American delivered record revenue in an evolving demand environment in the second quarter thanks to the hard work and dedication of our team,” said American’s CEO Robert Isom.
Company Overview
One of the ‘Big Four’ airlines in the US, American Airlines (NASDAQ: AAL) is a major global air carrier that serves both business and leisure travelers through its domestic and international flights.
Revenue Growth
A company’s long-term performance is an indicator of its overall quality. Any business can put up a good quarter or two, but the best consistently grow over the long haul. Over the last five years, American Airlines grew its sales at a 10.2% compounded annual growth rate. Although this growth is acceptable on an absolute basis, it fell short of our standards for the consumer discretionary sector, which enjoys a number of secular tailwinds.
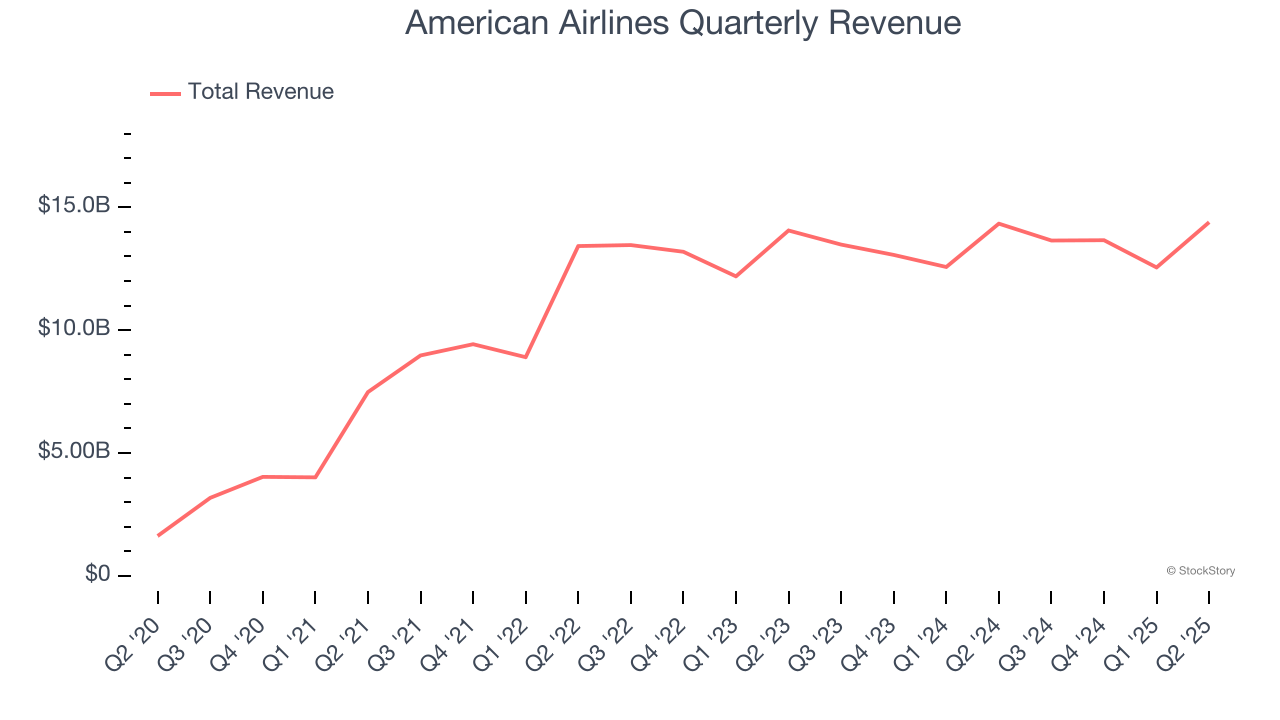
We at StockStory place the most emphasis on long-term growth, but within consumer discretionary, a stretched historical view may miss a company riding a successful new property or trend. American Airlines’s recent performance shows its demand has slowed as its annualized revenue growth of 1.3% over the last two years was below its five-year trend. 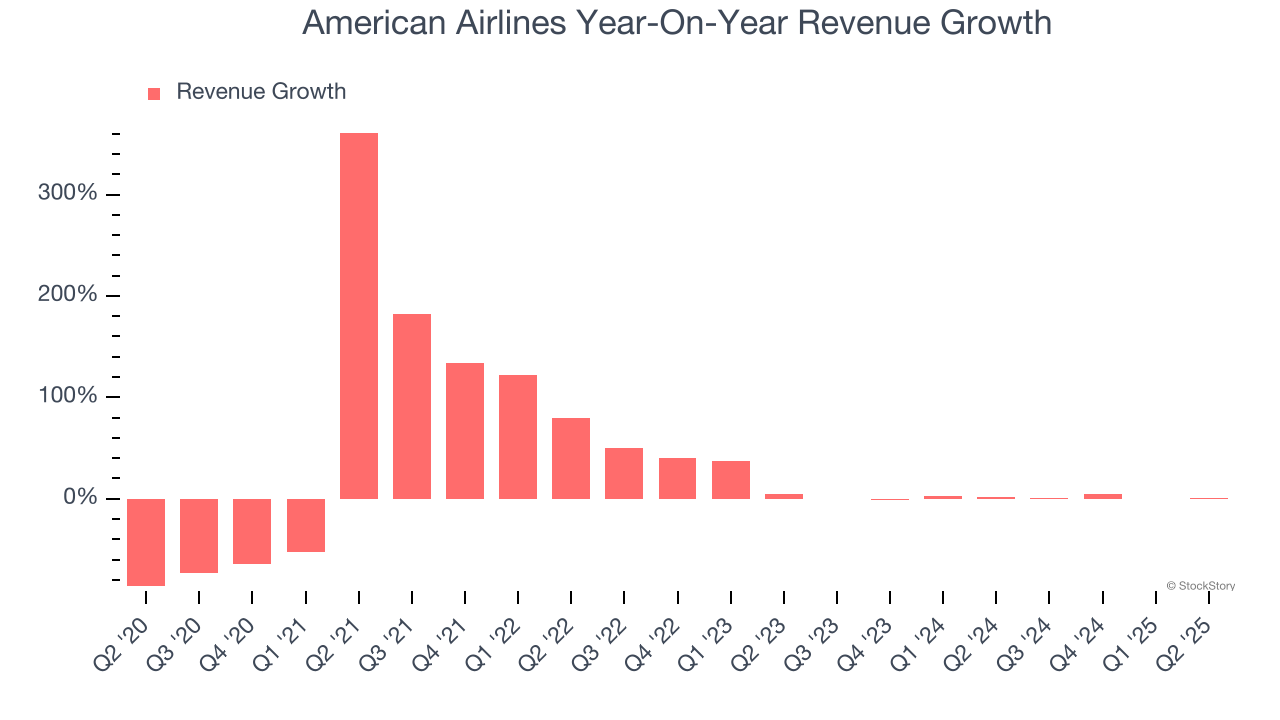
We can dig further into the company’s revenue dynamics by analyzing its number of revenue passenger miles, which reached 65.76 billion in the latest quarter. Over the last two years, American Airlines’s revenue passenger miles averaged 4.9% year-on-year growth. Because this number is higher than its revenue growth during the same period, we can see the company’s monetization has fallen. 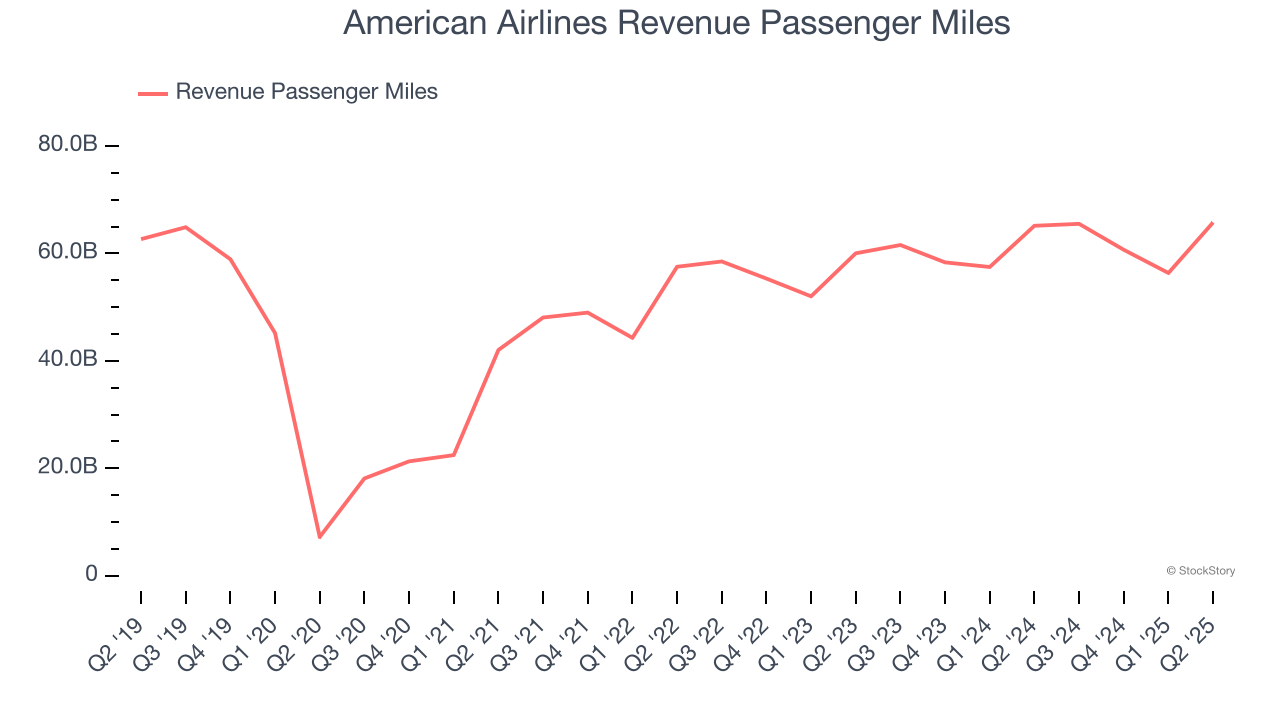
This quarter, American Airlines’s $14.39 billion of revenue was flat year on year but beat Wall Street’s estimates by 0.6%.
Looking ahead, sell-side analysts expect revenue to grow 3.1% over the next 12 months. Although this projection suggests its newer products and services will spur better top-line performance, it is still below average for the sector.
Software is eating the world and there is virtually no industry left that has been untouched by it. That drives increasing demand for tools helping software developers do their jobs, whether it be monitoring critical cloud infrastructure, integrating audio and video functionality, or ensuring smooth content streaming. Click here to access a free report on our 3 favorite stocks to play this generational megatrend.
Operating Margin
Operating margin is a key measure of profitability. Think of it as net income - the bottom line - excluding the impact of taxes and interest on debt, which are less connected to business fundamentals.
American Airlines’s operating margin might fluctuated slightly over the last 12 months but has remained more or less the same, averaging 3.6% over the last two years. This profitability was lousy for a consumer discretionary business and caused by its suboptimal cost structure.
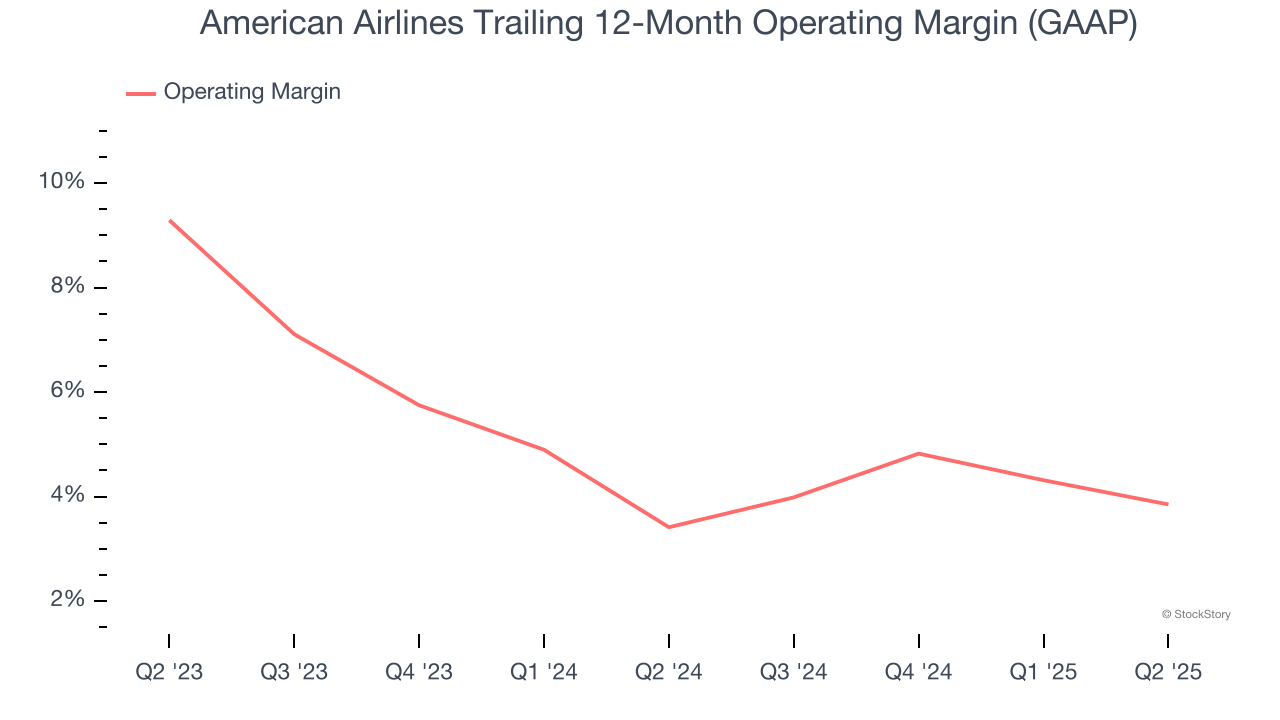
This quarter, American Airlines generated an operating margin profit margin of 7.9%, down 1.8 percentage points year on year. This reduction is quite minuscule and indicates the company’s overall cost structure has been relatively stable.
In the coming year, Wall Street expects American Airlines to maintain its trailing 12-month operating margin of 3.8%.
Earnings Per Share
We track the long-term change in earnings per share (EPS) for the same reason as long-term revenue growth. Compared to revenue, however, EPS highlights whether a company’s growth is profitable.
American Airlines’s full-year EPS flipped from negative to positive over the last five years. This is encouraging and shows it’s at a critical moment in its life.
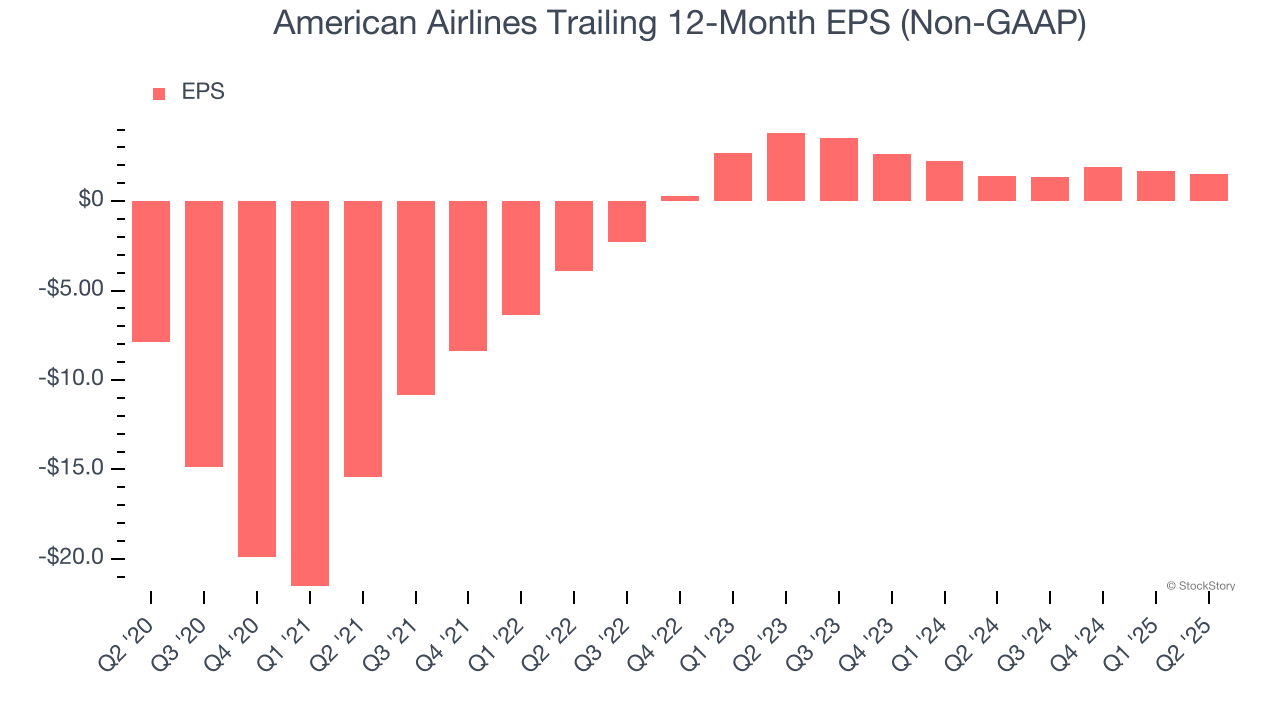
In Q2, American Airlines reported EPS at $0.95, down from $1.09 in the same quarter last year. Despite falling year on year, this print easily cleared analysts’ estimates. Over the next 12 months, Wall Street expects American Airlines’s full-year EPS of $1.52 to stay about the same.
Key Takeaways from American Airlines’s Q2 Results
We enjoyed seeing American Airlines beat analysts’ EPS expectations this quarter. On the other hand, its full-year EPS guidance missed. Overall, this was a weaker quarter. The stock traded down 5% to $12.07 immediately after reporting.
American Airlines’s earnings report left more to be desired. Let’s look forward to see if this quarter has created an opportunity to buy the stock. The latest quarter does matter, but not nearly as much as longer-term fundamentals and valuation, when deciding if the stock is a buy. We cover that in our actionable full research report which you can read here, it’s free.


