
Maritime shipping company Genco (NYSE: GNK) reported revenue ahead of Wall Street’s expectations in Q4 CY2024, with sales up 39% year on year to $99.2 million. Its non-GAAP profit of $0.29 per share was 3.8% below analysts’ consensus estimates.
Is now the time to buy Genco? Find out by accessing our full research report, it’s free.
Genco (GNK) Q4 CY2024 Highlights:
- Revenue: $99.2 million vs analyst estimates of $67.41 million (39% year-on-year growth, 47.2% beat)
- Adjusted EPS: $0.29 vs analyst expectations of $0.30 (3.8% miss)
- Adjusted EBITDA: $32.71 million vs analyst estimates of $29.74 million (33% margin, 10% beat)
- Operating Margin: 14.7%, up from 9.9% in the same quarter last year
- Free Cash Flow was -$17.45 million compared to -$48.74 million in the same quarter last year
- owned vessels: 42, down 4 year on year
- Market Capitalization: $613.6 million
John C. Wobensmith, Chief Executive Officer, commented, “During 2024, we grew earnings, while continuing to prioritize the three pillars of Genco’s comprehensive value strategy namely dividends, deleveraging and growth. Consistent with our commitment to returning significant capital to shareholders, we took steps to enhance our dividend policy aimed at increasing cash available for distribution on a quarterly basis. We are pleased to advance our track record of dividends to shareholders through market cycles, as Genco has now declared 22 consecutive quarterly dividends, representing $6.615 per share, or 45% of our stock price.
Company Overview
Headquartered in NYC, Genco (NYSE: GNK) is a shipping company that transports dry bulk cargo along worldwide maritime routes.
Marine Transportation
The growth of e-commerce and global trade continues to drive demand for shipping services, presenting opportunities for marine transportation companies. While ocean freight is more fuel efficient and therefore cheaper than its air and ground counterparts, it results in slower delivery times, presenting a trade off. To improve transit speeds, the industry continues to invest in digitization to optimize fleets and routes. However, marine transportation companies are still at the whim of economic cycles. Consumer spending, for example, can greatly impact the demand for these companies’ offerings while fuel costs can influence profit margins. Geopolitical tensions can also affect access to trade routes, and if certain countries are banned from using passageways like the Panama Canal, costs can spiral out of control.
Sales Growth
A company’s long-term performance is an indicator of its overall quality. While any business can experience short-term success, top-performing ones enjoy sustained growth for years. Over the last five years, Genco grew its sales at a decent 8.5% compounded annual growth rate. Its growth was slightly above the average industrials company and shows its offerings resonate with customers.
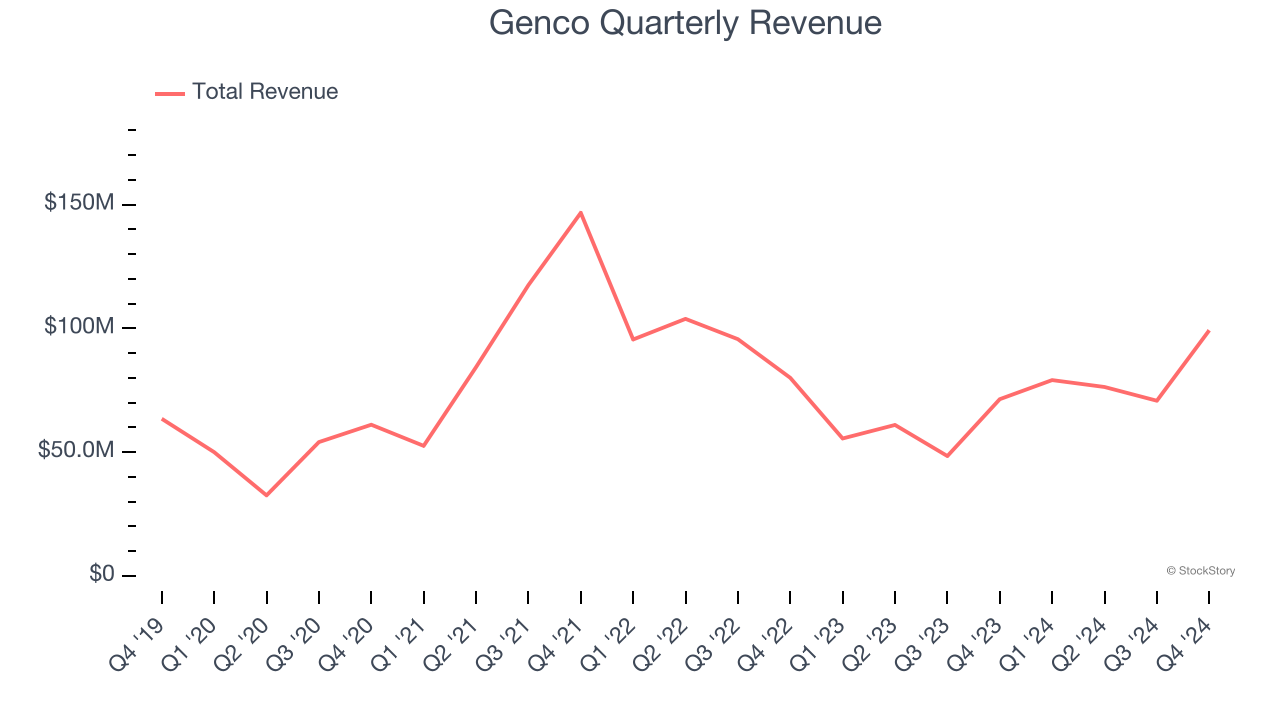
Long-term growth is the most important, but within industrials, a half-decade historical view may miss new industry trends or demand cycles. Genco’s recent history marks a sharp pivot from its five-year trend as its revenue has shown annualized declines of 6.9% over the last two years. Genco isn’t alone in its struggles as the Marine Transportation industry experienced a cyclical downturn, with many similar businesses observing lower sales at this time. 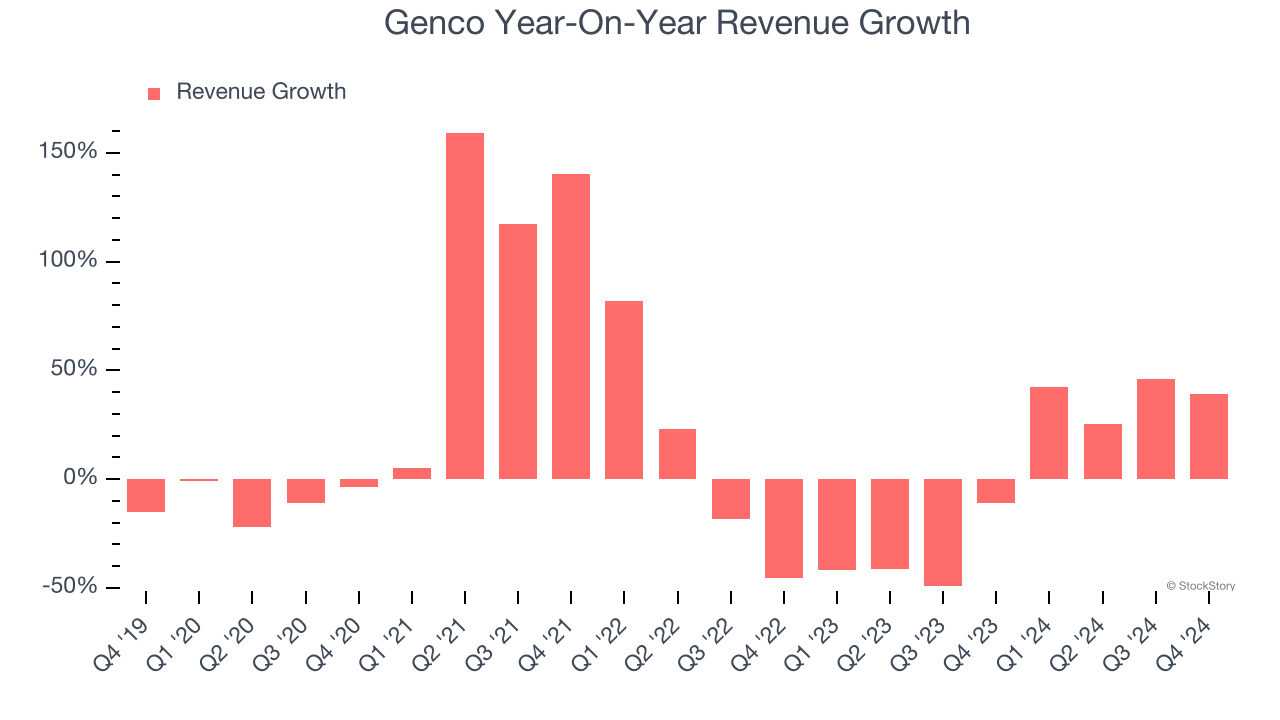
We can dig further into the company’s revenue dynamics by analyzing its number of owned vessels, which reached 42 in the latest quarter. Over the last two years, Genco’s owned vessels averaged 2% year-on-year growth. Because this number is higher than its revenue growth during the same period, we can see the company’s monetization has fallen. 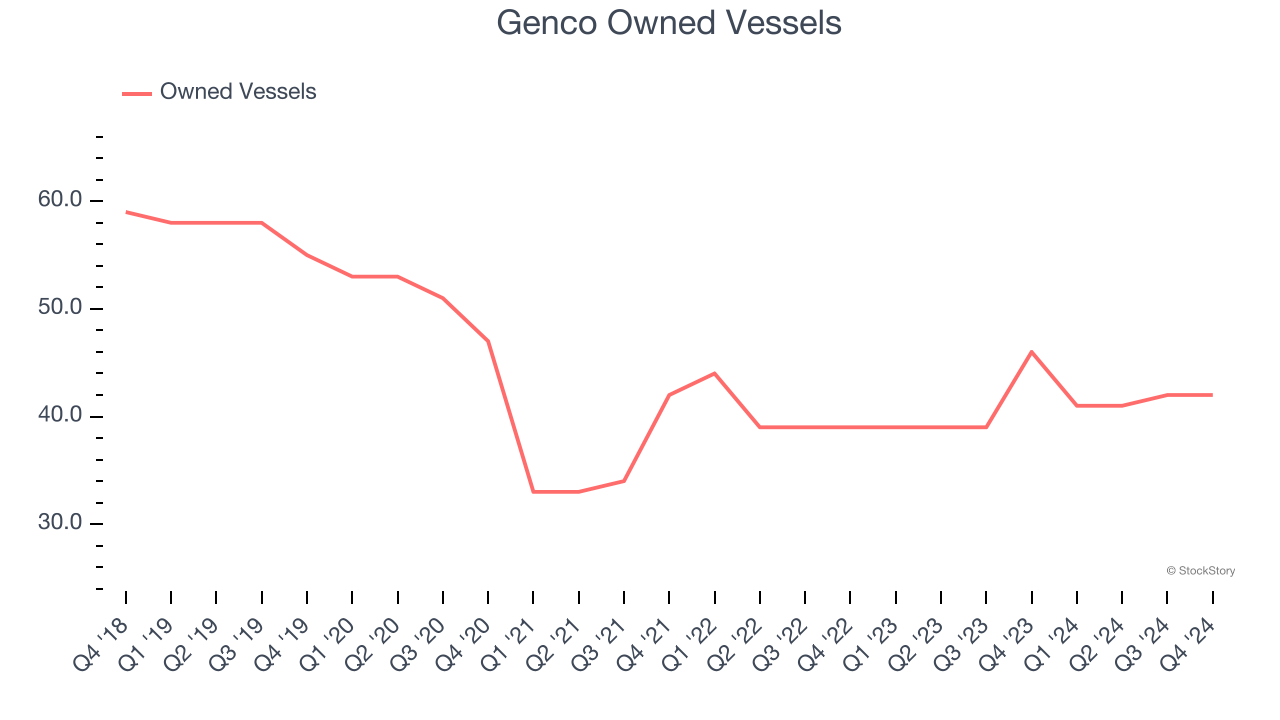
This quarter, Genco reported wonderful year-on-year revenue growth of 39%, and its $99.2 million of revenue exceeded Wall Street’s estimates by 47.2%.
Looking ahead, sell-side analysts expect revenue to decline by 22.5% over the next 12 months, a deceleration versus the last two years. This projection doesn't excite us and suggests its products and services will see some demand headwinds.
Software is eating the world and there is virtually no industry left that has been untouched by it. That drives increasing demand for tools helping software developers do their jobs, whether it be monitoring critical cloud infrastructure, integrating audio and video functionality, or ensuring smooth content streaming. Click here to access a free report on our 3 favorite stocks to play this generational megatrend.
Operating Margin
Operating margin is an important measure of profitability as it shows the portion of revenue left after accounting for all core expenses – everything from the cost of goods sold to advertising and wages. It’s also useful for comparing profitability across companies with different levels of debt and tax rates because it excludes interest and taxes.
Genco has been a well-oiled machine over the last five years. It demonstrated elite profitability for an industrials business, boasting an average operating margin of 16%. This result isn’t surprising as its high gross margin gives it a favorable starting point.
Looking at the trend in its profitability, Genco’s operating margin rose significantly over the last five years, as its sales growth gave it immense operating leverage.
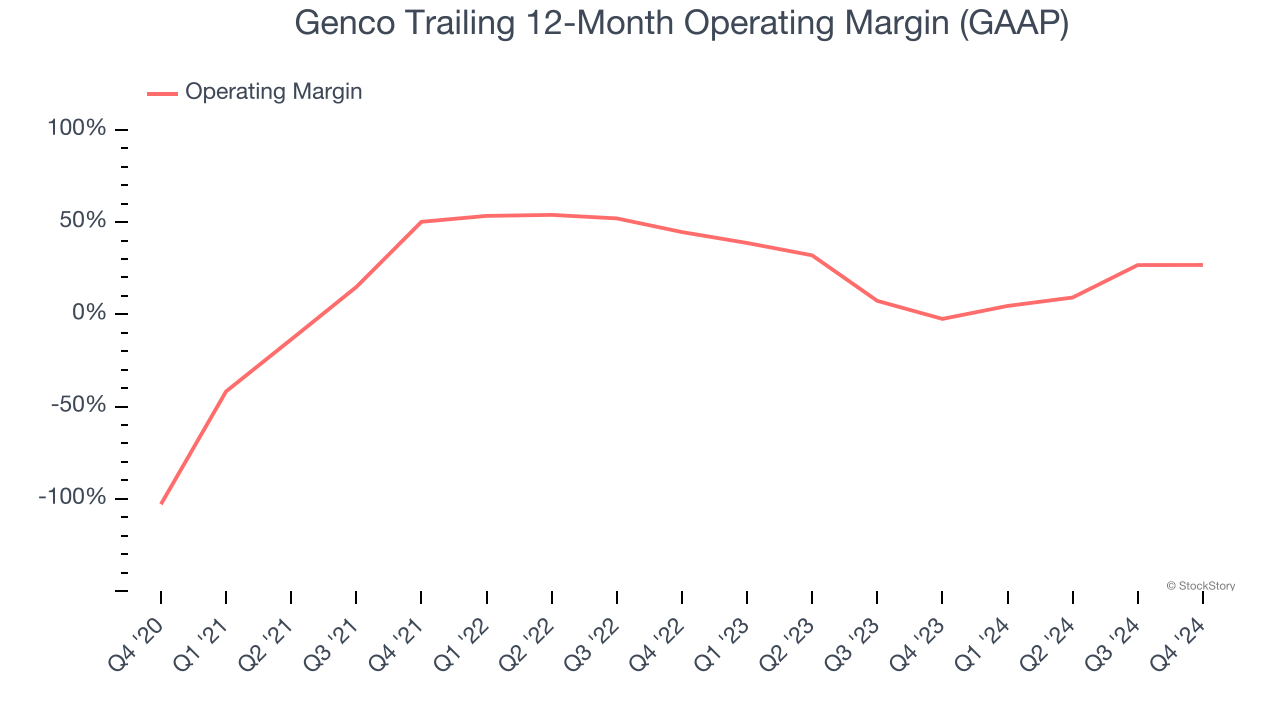
This quarter, Genco generated an operating profit margin of 14.7%, up 4.9 percentage points year on year. The increase was encouraging, and since its gross margin actually decreased, we can assume it was recently more efficient because its operating expenses like marketing, R&D, and administrative overhead grew slower than its revenue.
Earnings Per Share
Revenue trends explain a company’s historical growth, but the long-term change in earnings per share (EPS) points to the profitability of that growth – for example, a company could inflate its sales through excessive spending on advertising and promotions.
Genco’s full-year EPS flipped from negative to positive over the last five years. This is encouraging and shows it’s at a critical moment in its life.
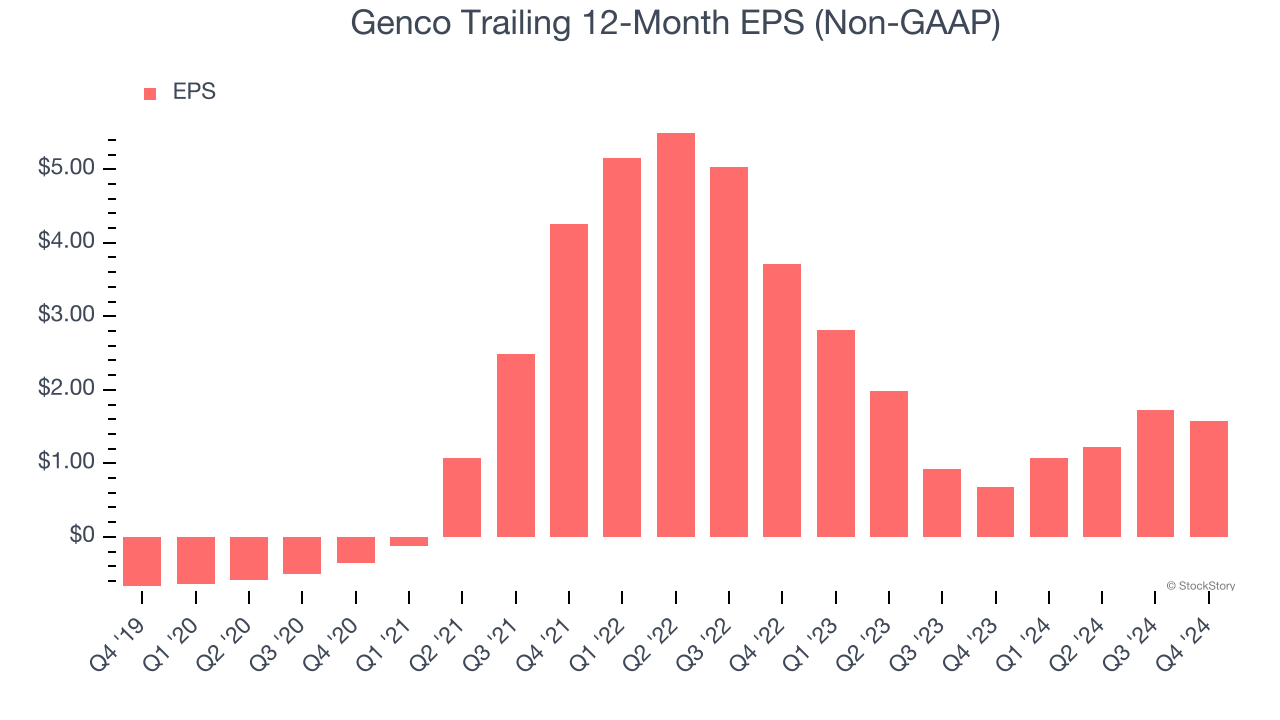
Like with revenue, we analyze EPS over a shorter period to see if we are missing a change in the business.
Sadly for Genco, its EPS declined by more than its revenue over the last two years, dropping 34.7%. This tells us the company struggled to adjust to shrinking demand.
Diving into the nuances of Genco’s earnings can give us a better understanding of its performance. While we mentioned earlier that Genco’s operating margin improved this quarter, a two-year view shows its margin has declined by 23.7 percentage pointswhile its share count has grown 1.8%. This means the company not only became less efficient with its operating expenses but also diluted its shareholders. 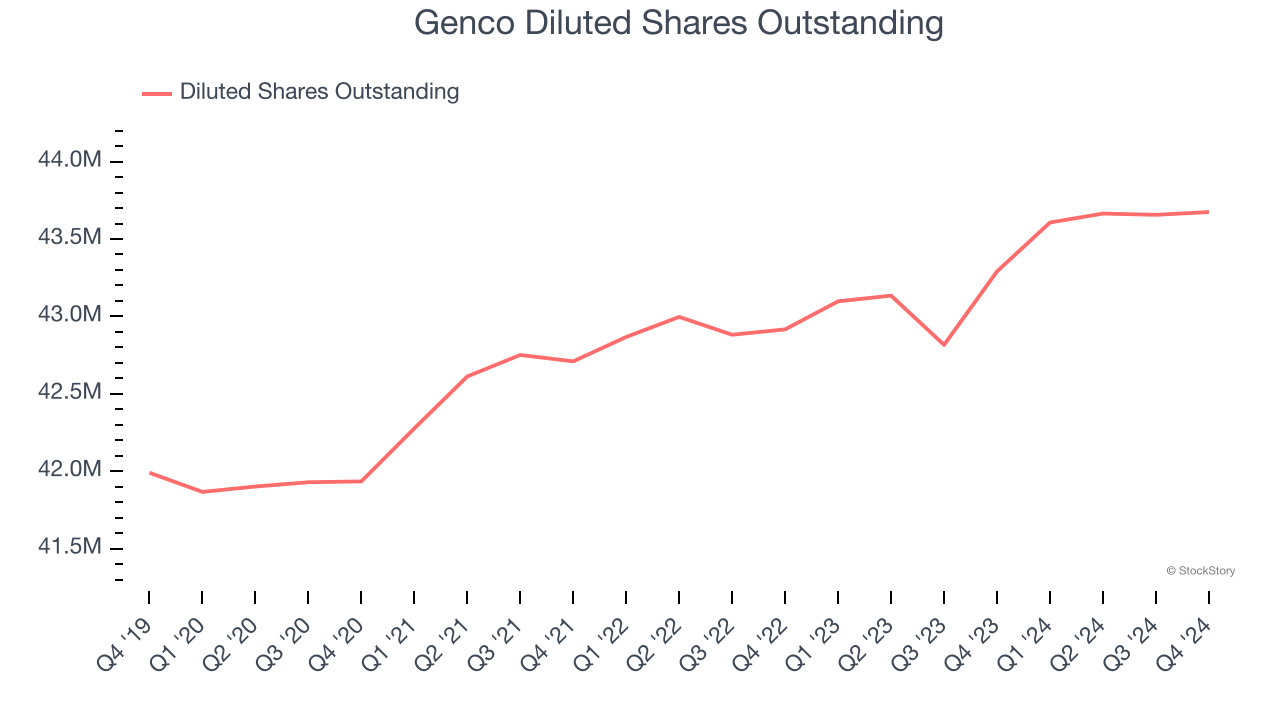
In Q4, Genco reported EPS at $0.29, down from $0.43 in the same quarter last year. This print missed analysts’ estimates, but we care more about long-term EPS growth than short-term movements. Over the next 12 months, Wall Street expects Genco’s full-year EPS of $1.58 to shrink by 51.2%.
Key Takeaways from Genco’s Q4 Results
We were impressed by how significantly Genco blew past analysts’ EBITDA expectations this quarter. We were also excited its revenue outperformed Wall Street’s estimates by a wide margin. Overall, we think this was a strong quarter with some key metrics above expectations. The stock remained flat at $14.50 immediately following the results.
Is Genco an attractive investment opportunity right now? When making that decision, it’s important to consider its valuation, business qualities, as well as what has happened in the latest quarter. We cover that in our actionable full research report which you can read here, it’s free.


