
Building products installation services company Installed Building Products (NYSE: IBP) beat Wall Street’s revenue expectations in Q3 CY2025, with sales up 2.3% year on year to $778.2 million. Its non-GAAP profit of $3.18 per share was 15.4% above analysts’ consensus estimates.
Is now the time to buy Installed Building Products? Find out by accessing our full research report, it’s free for active Edge members.
Installed Building Products (IBP) Q3 CY2025 Highlights:
- Revenue: $778.2 million vs analyst estimates of $748.5 million (2.3% year-on-year growth, 4% beat)
- Adjusted EPS: $3.18 vs analyst estimates of $2.76 (15.4% beat)
- Adjusted EBITDA: $139.9 million vs analyst estimates of $126.4 million (18% margin, 10.7% beat)
- Operating Margin: 13.7%, in line with the same quarter last year
- Free Cash Flow Margin: 13.5%, up from 10.2% in the same quarter last year
- Market Capitalization: $6.47 billion
“With another quarter of record financial performance, so far, 2025 has been an encouraging year for IBP. Our branches continue to execute at a high level, delivering reliable installation services to homebuilders of all sizes. While local market dynamics can vary greatly across the country, our results highlight the benefit of IBP’s scale, product and end-market diversity, a focus on service, and the trust we place in all of our branches to make the right decisions for their local markets,” stated Jeff Edwards, Chairman and Chief Executive Officer.
Company Overview
Founded in 1977, Installed Building Products (NYSE: IBP) is a company specializing in the installation of insulation, waterproofing, and other complementary building products for residential and commercial construction.
Revenue Growth
A company’s long-term sales performance can indicate its overall quality. Any business can experience short-term success, but top-performing ones enjoy sustained growth for years. Luckily, Installed Building Products’s sales grew at an excellent 13% compounded annual growth rate over the last five years. Its growth beat the average industrials company and shows its offerings resonate with customers.
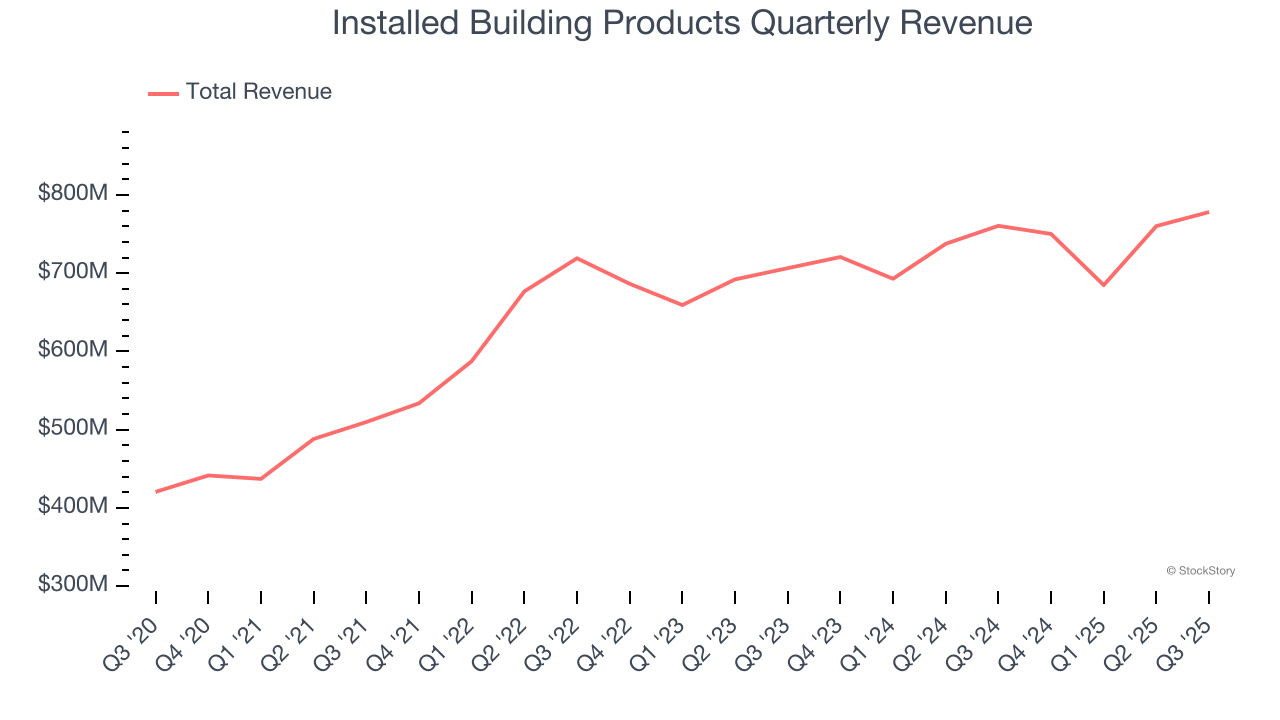
We at StockStory place the most emphasis on long-term growth, but within industrials, a half-decade historical view may miss cycles, industry trends, or a company capitalizing on catalysts such as a new contract win or a successful product line. Installed Building Products’s recent performance shows its demand has slowed significantly as its annualized revenue growth of 4.1% over the last two years was well below its five-year trend. 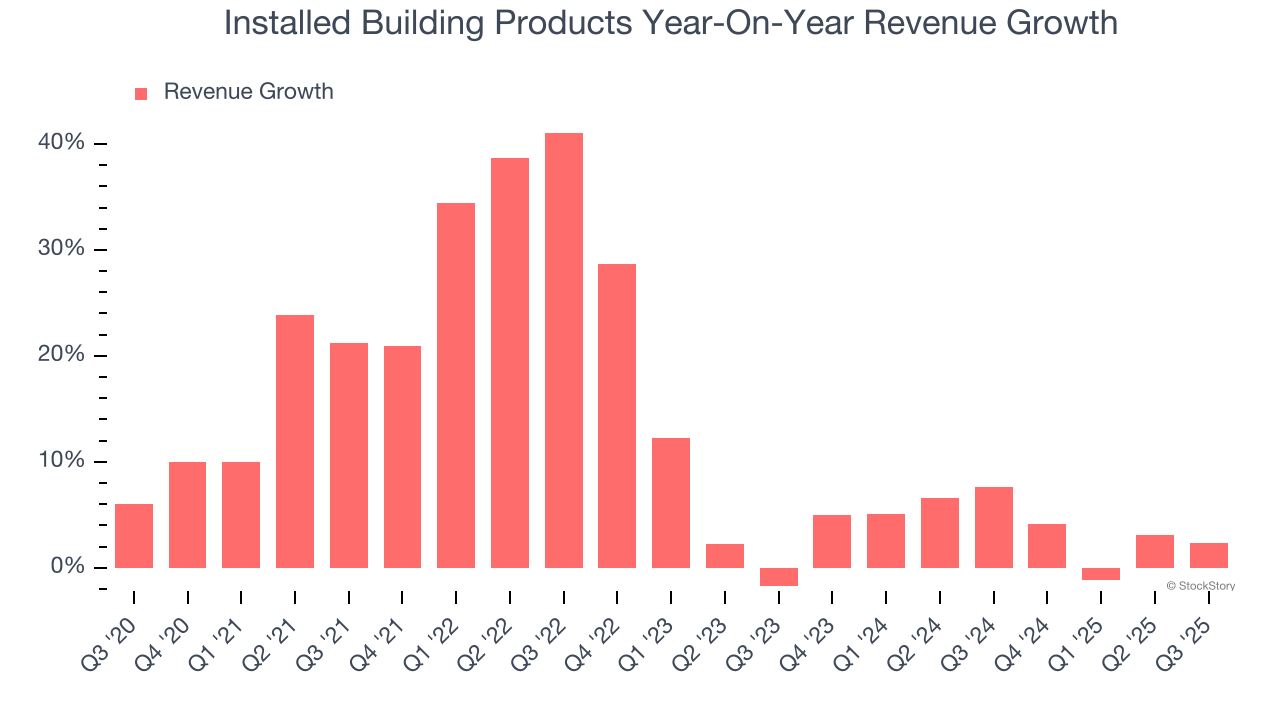
This quarter, Installed Building Products reported modest year-on-year revenue growth of 2.3% but beat Wall Street’s estimates by 4%.
Looking ahead, sell-side analysts expect revenue to decline by 3.2% over the next 12 months, a deceleration versus the last two years. This projection doesn't excite us and indicates its products and services will face some demand challenges.
Microsoft, Alphabet, Coca-Cola, Monster Beverage—all began as under-the-radar growth stories riding a massive trend. We’ve identified the next one: a profitable AI semiconductor play Wall Street is still overlooking. Go here for access to our full report.
Operating Margin
Operating margin is one of the best measures of profitability because it tells us how much money a company takes home after procuring and manufacturing its products, marketing and selling those products, and most importantly, keeping them relevant through research and development.
Installed Building Products has been an efficient company over the last five years. It was one of the more profitable businesses in the industrials sector, boasting an average operating margin of 12.3%.
Analyzing the trend in its profitability, Installed Building Products’s operating margin rose by 2.8 percentage points over the last five years, as its sales growth gave it operating leverage. Its expansion shows it’s one of the better Home Builders companies as most peers saw their margins plummet.
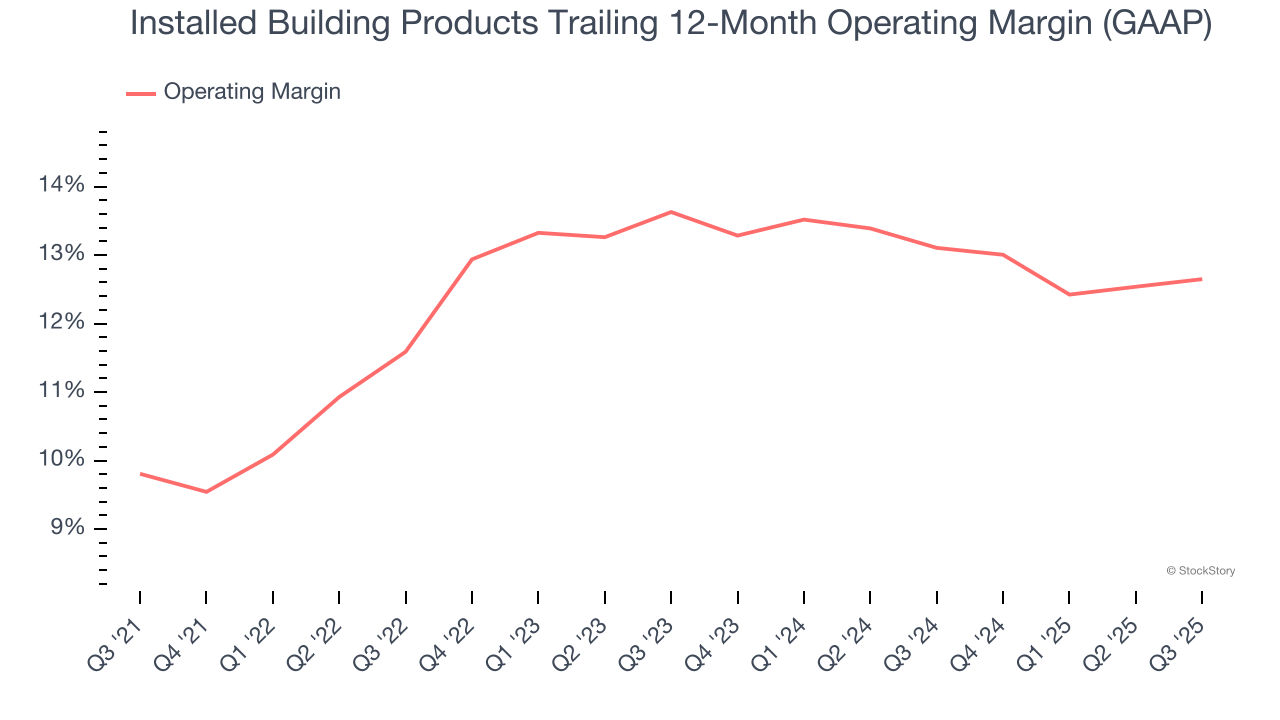
This quarter, Installed Building Products generated an operating margin profit margin of 13.7%, in line with the same quarter last year. This indicates the company’s cost structure has recently been stable.
Earnings Per Share
We track the long-term change in earnings per share (EPS) for the same reason as long-term revenue growth. Compared to revenue, however, EPS highlights whether a company’s growth is profitable.
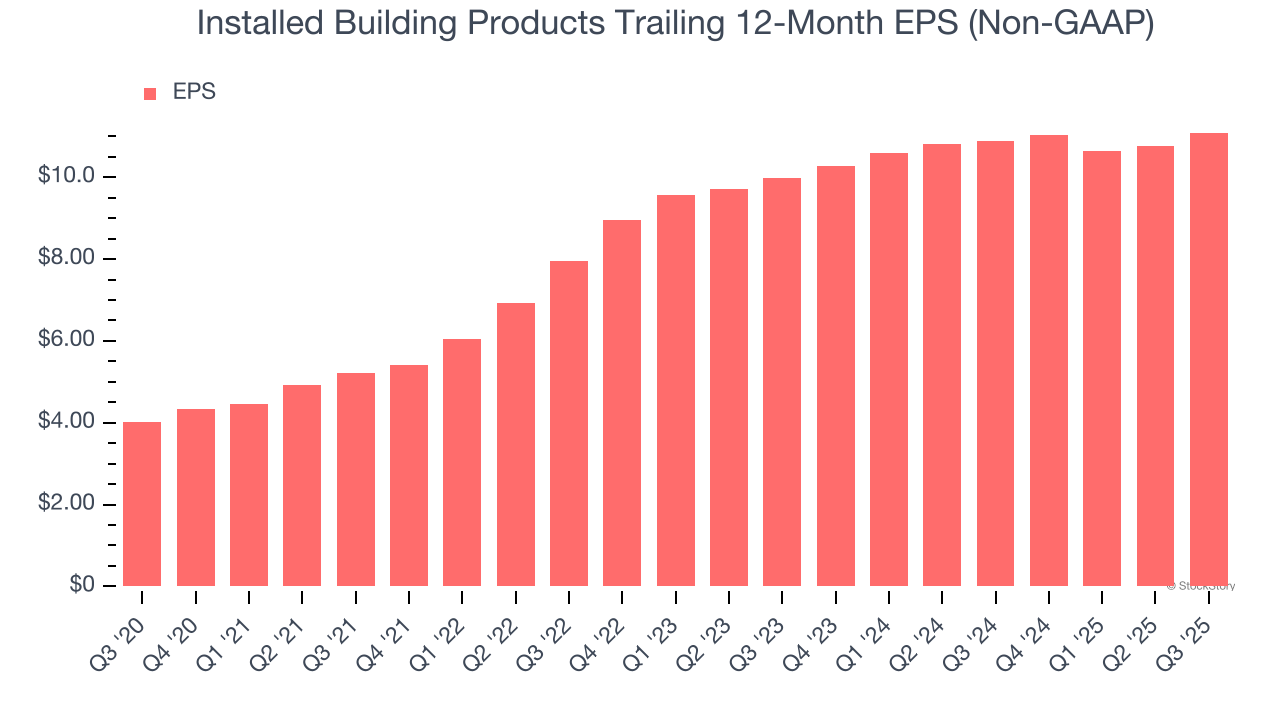
Installed Building Products’s EPS grew at an astounding 22.4% compounded annual growth rate over the last five years, higher than its 13% annualized revenue growth. This tells us the company became more profitable on a per-share basis as it expanded.
Diving into the nuances of Installed Building Products’s earnings can give us a better understanding of its performance. As we mentioned earlier, Installed Building Products’s operating margin was flat this quarter but expanded by 2.8 percentage points over the last five years. On top of that, its share count shrank by 8.5%. These are positive signs for shareholders because improving profitability and share buybacks turbocharge EPS growth relative to revenue growth. 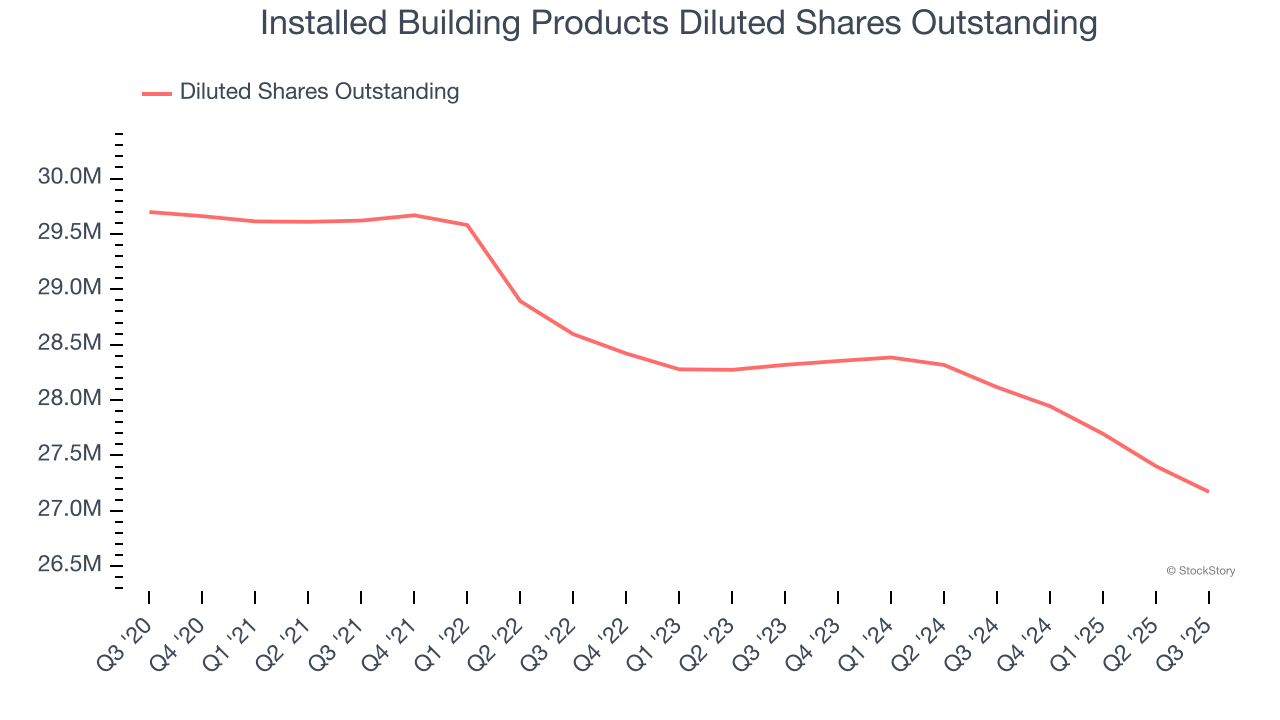
Like with revenue, we analyze EPS over a more recent period because it can provide insight into an emerging theme or development for the business.
For Installed Building Products, its two-year annual EPS growth of 5.4% was lower than its five-year trend. We hope its growth can accelerate in the future.
In Q3, Installed Building Products reported adjusted EPS of $3.18, up from $2.85 in the same quarter last year. This print easily cleared analysts’ estimates, and shareholders should be content with the results. Over the next 12 months, Wall Street expects Installed Building Products’s full-year EPS of $11.09 to shrink by 8.2%.
Key Takeaways from Installed Building Products’s Q3 Results
We were impressed by how significantly Installed Building Products blew past analysts’ EBITDA expectations this quarter. We were also excited its revenue outperformed Wall Street’s estimates by a wide margin. Zooming out, we think this quarter featured some important positives. The stock remained flat at $240.15 immediately after reporting.
Installed Building Products may have had a good quarter, but does that mean you should invest right now? The latest quarter does matter, but not nearly as much as longer-term fundamentals and valuation, when deciding if the stock is a buy. We cover that in our actionable full research report which you can read here, it’s free for active Edge members.


