- Hod Maden TRS Demonstrates a World-Class Project With an Estimated $1.66B NPV5% and Projected 39% Internal Rate of Return (“IRR”) at Consensus Metals Prices (1)
- Significant Project De-Risking Efforts Completed Over Last 18 Months, Detailed Project Engineering Nearing Completion With Most Major Contracts Tendered or in Place
- Total Remaining Project Development Capital Spend of $910 Million; SSR Mining’s Remaining Attributable Capital and Acquisition Earn-in Spend for Hod Maden Is Expected to Be Approximately $469 Million
- Hod Maden Is Expected to Generate Annual Operating Cash Flow of $343 Million and Free Cash Flow of $328 Million at Consensus Metals Prices (1, 2)
SSR Mining Inc. (Nasdaq/TSX: SSRM) (“SSR Mining” or the “Company”) announces the completion of a Technical Report Summary (“TRS”) for the Hod Maden project (“Hod Maden” or the “Project”), located in northeastern Türkiye (the “2025 Hod Maden TRS”).
This press release features multimedia. View the full release here: https://www.businesswire.com/news/home/20260128521929/en/
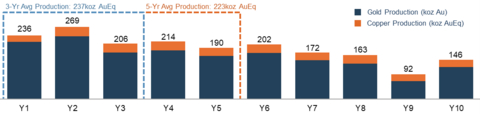
Figure 1: 2025 Hod Maden TRS – Production Summary (4)
Highlights of the 2025 Hod Maden TRS (all figures on a 100% basis and in U.S. dollars): (1, 2, 3)
-
Updated technical report reaffirms that Hod Maden is projected to be one of the highest returning undeveloped copper-gold projects globally
-
Estimated after-tax NPV5% of $1.66 billion and projected IRR of 39% at consensus gold and copper prices
- At recent spot gold and copper prices, Hod Maden’s after-tax NPV5% increases to an estimated $2.91 billion with a projected IRR of 58%
- Life of mine production is projected to total 1.6 million ounces of gold and 209 million pounds of copper at estimated average cost of sales of $1,120 per ounce of payable gold and estimated by-product all-in-sustaining costs (“AISC”) of $590 per ounce of payable gold
-
Annual after-tax operating cash flow and free cash flow are expected to average $343 and $328 million, respectively, at consensus metals prices
- At recent spot gold and copper prices, annual after-tax operating cash flow and free cash flow are expected to average $511 and $496 million, respectively
-
Estimated after-tax NPV5% of $1.66 billion and projected IRR of 39% at consensus gold and copper prices
-
Project execution meaningfully de-risked through significant engineering work completed since acquisition
- The significant amount of detailed engineering completed since SSR Mining’s acquisition, coupled with early works activities completed to-date, has meaningfully de-risked project execution
- Detailed project engineering is now nearing completion, with most major contracts tendered or in place and all key Hod Maden project development team members onboard
- Total remaining development capital spend, estimated at $910 million as of November 30, is supported by the high level of design definition in the most critical areas of project construction planning, including main access roads, earthworks and camp construction
(1) |
Consensus gold and copper prices used in the 2025 Hod Maden TRS average $3,167 per ounce and $4.52 per pound, respectively, over the life of mine. References to spot prices in this document reflect a $4,900 per ounce gold price and $5.75 per pound copper price. See “Assumptions” for additional information. Average annual after-tax operating cash flow and Free Cash Flow metrics are calculated over the period of 2028 to 2037. |
||||||
(2) |
The Company reports non-GAAP financial measures including All-In Sustaining Cost (“AISC”) per ounce sold (a common measure in the mining industry) and Free Cash Flow to manage and evaluate its operating performance at its mines. See "Cautionary Note Regarding Non-GAAP Financial Measures" for an explanation of these financial measures and a reconciliation of these financial measures to the most comparable GAAP financial measures. |
||||||
(3) |
Upon completion of the earn-in, SSR Mining will have a 40% ownership interest in Hod Maden. See “Overview of the Hod Maden Project” for additional information on SSR Mining’s ownership in Hod Maden. |
||||||
Rod Antal, Executive Chairman of SSR Mining, said, “Since acquiring operatorship and an up to 40% stake in Hod Maden in 2023, our teams have been hard at work advancing the Project as outlined in today’s Technical Report Summary. This is a major milestone for our Company and clearly reaffirms Hod Maden’s position amongst the most compelling undeveloped copper-gold projects globally.
Today’s TRS is supported by our significant efforts to de-risk the Project and its development timeline over the last two years. This includes meaningful progress on early works activities at site, including earthworks and road development, along with advancement of detailed engineering, hiring and procurement. Going forward, SSR Mining’s remaining investment in the Project is expected to total approximately $469 million. This includes $364 million for 40% of the attributable development capital costs and $105 million in remaining earn-in and milestone payments. This investment is expected to be funded from our existing liquidity position.
At consensus metals prices, Hod Maden is expected to generate $328 million in free cash flow annually ($131 million attributable to SSR Mining based on a 40% ownership) and deliver a project IRR of nearly 40%. The new capital estimate contained in the TRS reflects the outcomes of highly detailed technical workstreams and material inflationary impacts over the past two years in Türkiye. A project decision is expected in 2026, following the approvals of our local Joint Venture partner. Once in production, we expect our portfolio to benefit from this tremendous asset’s exceptional margins for years to come.”
The TRS has been prepared in accordance with Regulation S-K 1300 (“S-K 1300”) and will be available as of January 29, 2026 on the Company’s website and on a Current Report on Form 8-K to be filed with the U.S. Securities and Exchange Commission (“SEC”).
Key Improvements from the 2021 Feasibility Study
The 2025 Hod Maden TRS supersedes the “Hod Maden Project, Feasibility Study – Technical Report NI 43-101”, dated December 15, 2021. Optimizations to the Project included in the 2025 Hod Maden TRS include:
- The flowsheet was updated to produce a single copper concentrate, improving upon the prior plan which produced both a copper concentrate and a pyrite concentrate and thereby required batch processing of two ore types. This change is expected to meaningfully simplify process plant operations and increase performance while producing a high-quality, marketable concentrate
- Infill drilling has been conducted to derisk early phases of the Hod Maden life of mine plan, improving Mineral Reserve confidence and helping to ensure delivery of the Project’s rapid payback
- Significant refinements to project infrastructure design have been made, including optimized earthwork volumes, improved access road alignment, and consolidation of waste storage areas
- Detailed engineering of the Project is now nearing completion, de-risking the critical path for project development and improving fidelity in the associated capital costs
- A highly detailed project execution plan was developed to manage the Project, and all key positions of the project execution team have been filled to support the anticipated ramp up of activities
- SSR Mining has made significant progress on engineering and initial site establishment efforts over the course of 2025
| Table 1: 2025 Hod Maden TRS – Key Metrics (4) | |||
Operating Metrics |
Unit |
|
Life of Mine (2025 – 2038) |
Total Gold Production |
koz |
|
1,609 |
Average Annual Gold Production (5) |
koz |
|
159 |
Total Copper Production |
Mlb |
|
209 |
Average Annual Copper Production (5) |
Mlb |
|
21 |
Average Annual Gold Equivalent Production (5) |
koz |
|
189 |
|
|
|
|
Total Material Mined |
kt |
|
9,196 |
Ore Processed |
kt |
|
7,726 |
Gold Grade Processed |
g/t |
|
7.6 |
Gold Recovery |
% |
|
87% |
Copper Grade Processed |
% |
|
1.3% |
Copper Recovery |
% |
|
97% |
|
|
|
|
Cost of Sales |
$/oz Au sold |
|
$1,120 |
Cash Costs (6) |
$/oz Au sold |
|
$535 |
All-In Sustaining Costs (6) |
$/oz Au sold |
|
$590 |
|
|
|
|
Capital Costs |
|
|
|
Development Capital |
$M |
|
$910 |
Sustaining Capital |
$M |
|
$75 |
Reclamation |
$M |
|
$14 |
Total Capital |
$M |
|
$999 |
|
|
|
|
Project Economics at Consensus Metals Prices (7) |
|
|
|
Total Operating Cash Flow |
$M |
|
$3,452 |
Total Capital Costs (Including Reclamation) |
$M |
|
$999 |
Total Free Cash Flow (6) |
$M |
|
$2,453 |
Average Annual Free Cash Flow (5,6) |
$M |
|
$328 |
|
|
|
|
After-Tax NPV5% |
$M |
|
$1,657 |
After-Tax IRR |
% |
|
39% |
(4) |
Upon completion of the earn-in, SSR Mining will have a 40% ownership interest in Hod Maden. All figures are presented on a 100% basis. Please see the “Hod Maden Technical Report Summary” filed with the SEC on a Current Report on Form 8-K for additional details. Certain figures may not add due to rounding. |
||||||
(5) |
Average annual production and Free Cash Flow metrics are calculated over the period of 2028 to 2037. Gold equivalent ounces (“GEOs”) are calculated using the copper sold multiplied by the ratio of the copper price to the gold price at the average commodity prices for the period stated in the TRS. |
||||||
(6) |
The Company reports non-GAAP financial measures including AISC per ounce of gold sold (a common measure in the mining industry) and Free Cash Flow to manage and evaluate its operating performance at its mines. See "Cautionary Note Regarding Non-GAAP Financial Measures" for an explanation of these financial measures and a reconciliation of these financial measures to the most comparable GAAP financial measures. |
||||||
(7) |
Consensus gold and copper prices used in the Hod Maden TRS average $3,167 per ounce and $4.52 per pound, respectively, over the life of mine. See “Assumptions” for additional information. |
||||||
Table 2: 2025 Hod Maden TRS – After-Tax NPV & IRR Sensitivity (8) |
||||||
Life of Mine Gold Prices |
$/oz |
|
$2,217 |
Base Case (9) $3,167 |
$3,642 |
$4,117 |
Sensitivity |
% |
|
-30% |
— |
+15% |
+30% |
NPV5% |
$M |
|
$852 |
$1,657 |
$2,056 |
$2,427 |
IRR |
% |
|
24.3% |
39.0% |
45.6% |
51.6% |
|
|
|
|
|
|
|
Development Capital Costs |
$M |
|
$864 |
Base Case $910 |
$1,046 |
$1,183 |
Sensitivity |
% |
|
-5% |
— |
+15% |
+30% |
NPV5% |
$M |
|
$1,692 |
$1,657 |
$1,552 |
$1,447 |
IRR |
% |
|
41.2% |
39.0% |
33.5% |
29.1% |
(8) |
Upon completion of the earn-in, SSR Mining will have a 40% ownership interest in Hod Maden. All figures are presented on a 100% basis; Please see the “Hod Maden Technical Report Summary” filed with the SEC on a Current Report on Form 8-K for additional details. |
||||||
(9) |
Base Case gold price assumption averages $3,433/oz from 2025 to 2030 and $3,094/oz for the remainder of the mine life. For the purposes of this sensitivity analysis, copper prices were unchanged from consensus prices. See “Assumptions” for additional information. |
||||||
Hod Maden Mineral Reserves and Mineral Resources (“MRMR”) (10)
(10) |
Please see “Supplemental Mineral Reserve and Mineral Resource Information” at the end of this press release for additional details. Mineral Resources are exclusive of Mineral Reserves. Numbers may not add due to rounding. |
||||||
Table 3: Hod Maden Mineral Reserves and Resources as of August 31, 2025 |
||||||||
|
|
Tonnes |
|
Grade |
|
Contained Metal |
||
(100% attributable) |
|
kt |
|
g/t Au |
% Cu |
|
koz Au |
Mlb Cu |
Total P+P Reserves |
|
7,714 |
|
7.6 |
1.3% |
|
1,896 |
223 |
M&I Mineral Resources |
|
1,722 |
|
11.9 |
1.7% |
|
658 |
65 |
Inferred Mineral Resources |
|
2,574 |
|
3.4 |
0.5% |
|
281 |
26 |
Overview of the Hod Maden Project
The Hod Maden Project is located in northeastern Türkiye. The Project is located approximately 130 kilometers from the Erzurum airport, and approximately 330 kilometers from SSR Mining’s Çöpler gold mine.
The Hod Maden project is 100% owned by Artmin, a company jointly-owned by SSR Mining, Lidya Mines, and Royal Gold, Inc. (“Royal Gold”). As per the 2023 Transaction structure, SSR Mining will earn-in to own up to 40% of the project through earn-in payments totaling $120 million, and will also make an additional $30 million in milestone payments to Lidya Mines. Following the completion of the earn-in, Artmin will be 40% owned by SSR Mining, 30% owned by Royal Gold, and 30% owned by Lidya Mines. SSR Mining currently owns 10% of the Project and serves as sole operator.
The Hod Maden deposit is part of the Artvin mineral district within the Eastern Pontides metallogenic belt. Hod Maden is comprised of three zones: the Main Zone, the South Zone, and approximately one kilometer further to the south, the Russian Zone. The Main Zone, first discovered by drilling in 2014, extends approximately 150 meters along strike at surface and has a true thickness of up to 70 meters and a down-dip extension of approximately 400 meters. The Main Zone contains most of the high-grade gold and copper mineralization and all of the currently defined Mineral Reserves at the Project. Limited drilling has been completed across the remainder of the Hod Maden property.
Mining & Processing
The 2025 Hod Maden TRS envisages an underground operation accessed through a single surface portal. Mining will be conducted via drift and fill (“DAF”) above 780 meters above sea level (masl) and via long-hole stoping below 780 masl, with overall mining rates averaging approximately 2,200 tonnes per day or 800,000 tonnes per annum. Life of mine ore grades are expected to average 7.6 g/t gold and 1.3% copper. The process plant will feature a design capacity of 800,000 dry metric tonnes per year and will utilize a mill-float-regrind-cleaner float flowsheet yielding a single concentrate with an average grade of 22% copper and 113 g/t gold. The concentrate can be sold through traders or directly to smelters and is expected to be highly desirable due to its grade and lack of deleterious elements. No cyanide is utilized in the process facility. Over the life of mine, gold and copper recoveries are expected to average 87% and 97%, respectively.
The Hod Maden project will be connected to Türkiye’s national power grid, which runs directly across the property. Tailings generated during the life of mine will be in part utilized for underground paste fill, with the remainder reporting to the Hod Maden Tailings Storage Facility (“TSF”). The TSF will employ a phased downstream construction technique, and will adhere to Canadian Dam Association Safety Guidelines. Royal Gold holds a 2% net smelter returns (“NSR”) royalty over the Hod Maden property, and at consensus metals prices Turkish State Royalties are expected to average 12.8% over the life of mine, inclusive of the 2025 royalty rate increase and on-site processing deductions for gold and copper.
Capital Estimates
The Project capital cost estimate can be classified as a high level 3 estimate using the Association for the Advancement of Cost Engineering (AACE) international classification system, due to the high level of design definition in the most critical areas: construction and operational support facilities, earthworks, process plant and the main access roads. The capital cost estimate for the Project has a high level of quotations, with awarded contracts plus formal or recent tender submissions totaling 85% of the total value of the budget. Including the sunk costs, the total value is 91%. The tender submissions are based on the latest engineering and include unit rates for labor, overhead costs and productivity rates.
Table 4: 2025 Hod Maden TRS – Project Capital Breakdown (11) |
||||
Description |
|
Amount ($M) |
|
Amount (%) |
Underground Mine Development |
|
$77 |
|
8% |
Process Facility |
|
$84 |
|
9% |
Site & Regional Infrastructure |
|
$304 |
|
33% |
EPCM, Site Support & Other |
|
$189 |
|
21% |
Contingency |
|
$106 |
|
12% |
| Escalation (12) | $150 |
16% |
||
Go-Forward Development Capital Costs as of Nov 30, 2025 |
|
$910 |
|
100% |
(11) |
Of the total project capital, approximately 60% is expected to be incurred in Turkish Lira, with the majority of the remaining spend in U.S. dollars. |
||||||
(12) |
Escalation is not included in the base capital estimate or contingency calculation. An allowance of $150 million has been incorporated into the total capital estimate to account for potential inflation in the Turkish market during the construction period. |
||||||
Permitting, Environment & Social
The Hod Maden licenses cover approximately 3,500 hectares, consisting primarily of forestry and private lands. All 349 parcels of private land within the Project area that required expropriation have been acquired. Environmental and social baseline studies have been conducted in the Project area since 2013, and an Environmental Impact Assessment (“EIA”) for Hod Maden was approved in 2021. The paste fill permit required for mining operations is progressing through the regulatory process and is anticipated to be approved in 2027.
A stakeholder engagement plan has been established for Hod Maden, through which the Company will continue engagement activities and plans to support the local communities through employment, local contract opportunities, local purchasing, and community development programs. This plan has resulted in a number of community projects in the villages proximal to the Project area, including road upgrades, construction of a social facility for local residents, repairs to local irrigation infrastructure and also the issuance of more than 30 scholarships to university students from the local communities.
Additional Potential for Upside at Hod Maden
The 2025 Hod Maden TRS presents a mine life to 2037 based exclusively on Mineral Reserves. Opportunities for potential growth and mine life extension exist across the Hod Maden property, which SSR Mining will continue to evaluate going forward. These include:
- Additional studies to convert the Measured and Indicated (“M&I”) resources above the Drift and Fill area to Reserves. This area was previously classified as Mineral Reserves but has been reported as M&I Mineral Resources in the 2025 Hod Maden TRS.
- Exploration activities proximal to the main Hod Maden deposit, including drilling of the South Zone, are planned for 2026 with an objective to convert existing Mineral Resources to Mineral Reserves while also targeting potential Mineral Resource growth.
- Advancing earlier stage, generative exploration programs across the broader Hod Maden property. Minimal exploration has been completed across the greater Hod Maden property, creating an opportunity to leverage advanced geophysical techniques to potentially discover additional massive sulfide ore bodies.
Assumptions
All figures are in U.S. dollars, unless otherwise noted. In the calculation of Mineral Reserves, the gold price used was $1,700 per ounce and the copper price was $3.50 per pound. In the calculation of Mineral Resources, the gold price used was $2,000 per ounce and the copper price was $4.00 per pound. The Hod Maden TRS is based on consensus gold prices of: 2025 - $3,322/oz; 2026 - $3,793/oz; 2027 - $3,704/oz; 2028 - $3,396/oz; 2029 - $3,252/oz; 2030 - $3,130/oz; and long-term - $3,094/oz, and consensus copper prices of: 2025 - $4.38/lb; 2026 - $4.56/lb; 2027 - $4.63/lb; 2028 - $4.68/lb; 2029 - $4.67/lb; 2030 - $4.44/lb; and long-term - $4.48/lb. The TRS assumes a Turkish Lira to USD exchange of 41:1.
All references to tonnage in this press release are in metric tonnes unless otherwise noted. Key assumptions used in the preparation of the TRS are subject to risks and uncertainties described under “Cautionary Note Regarding Forward-Looking Information and Statements”. All figures are presented on a 100% ownership of Hod Maden basis, unless otherwise noted.
About SSR Mining
SSR Mining is listed under the ticker symbol SSRM on the Nasdaq and the TSX.
Hod Maden Technical Report Summary
The 2025 Hod Maden TRS is an exhibit to our Current Report on Form 8-K that is anticipated to be filed with the SEC by January 29, 2026 and subsequently be available for review on EDGAR at sec.gov. This press release does not purport to be a complete summary of the Hod Maden TRS and is qualified in its entirety by reference to the Hod Maden TRS that we will file with the SEC. You should read this press release in conjunction with the Hod Maden TRS, including the qualifications and limitations described therein, as there may be information in the Hod Maden TRS that may be important.
SSR Mining currently holds operatorship and owns 10% of Hod Maden with the option to earn-in to up to 40% ownership. Lidya Mines currently holds 60% ownership of the project, with Royal Gold owning the remaining 30%. Upon completion of the earn-in process, Hod Maden will be owned 40% by SSR Mining, 30% by Lidya Mines and 30% by Royal Gold.
Cautionary Note Regarding Forward-Looking Information and Statements:
Except for statements of historical fact relating to us, certain statements contained in this news release, including statements related to our expectations and projections related to Hod Maden, constitute forward-looking information, future oriented financial information, or financial outlooks (collectively “forward-looking information”) within the meaning of applicable securities laws. Forward-looking information may be contained in this document and our other public filings. Forward-looking information relates to statements concerning our outlook and anticipated events or results and in some cases, can be identified by terminology such as “may”, “will”, “could”, “should”, “expect”, “plan”, “anticipate”, “believe”, “intend”, “estimate”, “projects”, “predict”, “potential”, “continue” or other similar expressions concerning matters that are not historical facts.
Forward-looking information and statements in this news release are based on certain key expectations and assumptions made by us. Although we believe that the expectations and assumptions on which such forward-looking information and statements are based are reasonable, undue reliance should not be placed on the forward-looking information and statements because we can give no assurance that they will prove to be correct. Forward-looking information and statements are subject to various risks and uncertainties which could cause actual results and experience to differ materially from the anticipated results or expectations expressed in this news release. The key risks and uncertainties include, but are not limited to: local and global political and economic conditions and hostilities; governmental and regulatory requirements and actions by governmental authorities, including changes in government policy, government ownership requirements, changes in environmental, tax and other laws or regulations and the interpretation thereof; risks and uncertainties resulting from the incident at Çöpler described in our most recent Annual Report on Form 10-K; and other risk factors detailed from time to time in our reports filed with the Securities and Exchange Commission on EDGAR and the Canadian securities regulatory authorities on SEDAR.
Forward-looking information and statements in this news release include any statements concerning, among other things: all information related to the Company’s Hod Maden operations, including forecasts and outlook; preliminary cost reporting in this document; timing, production, operating, cost, and capital expenditure guidance; our operational and development targets and catalysts and the impact of any suspensions on operations; the results of any gold reconciliations; the ability to discover additional oxide gold ore; the generation of Free Cash Flow and payment of dividends; matters relating to proposed exploration; communications with local stakeholders; maintaining community and government relations; joint venture partner project financing; the timing of final construction approval by the joint venture; negotiations of joint ventures; negotiation and completion of transactions; commodity prices; Mineral Resources, Mineral Reserves, conversion of Mineral Resources, realization of Mineral Reserves, and the existence or realization of Mineral Resource estimates; the development approach; the timing and amount of future production; the timing of studies, announcements, and analysis; the timing of construction and development of proposed mines and process facilities; capital and operating expenditures; economic conditions; availability of sufficient financing; exploration plans; receipt of regulatory approvals; timing and impact surrounding suspension or interruption of operations as a result of regulatory requirements or actions by governmental authority; and any and all other timing, exploration, development, operational, financial, budgetary, economic, legal, social, environmental, regulatory, and political matters that may influence or be influenced by future events or conditions.
Such forward-looking information and statements are based on a number of material factors and assumptions, including, but not limited in any manner to, those disclosed in any other of our filings on EDGAR and SEDAR, and include: the assumptions made in respect of the Company’s Çöpler operations; the inherent speculative nature of exploration results; the ability to explore; communications with local stakeholders; maintaining community and governmental relations; status of negotiations of joint ventures; weather conditions at our operations; commodity prices; the ultimate determination of and realization of Mineral Reserves; existence or realization of Mineral Resources; the development approach; availability and receipt of required approvals, titles, licenses and permits; sufficient working capital to develop and operate the mines and implement development plans; access to adequate services and supplies; foreign currency exchange rates; interest rates; access to capital markets and associated cost of funds; availability of a qualified work force; ability to negotiate, finalize, and execute relevant agreements; the Company’s ability to efficiently integrate acquired mines and businesses and to manage the costs related to any such integration, or to retain key technical, professional or management personnel; lack of social opposition to our mines or facilities; lack of legal challenges with respect to our properties; the timing and amount of future production; the ability to meet production, cost, and capital expenditure targets; timing and ability to produce studies and analyses; capital and operating expenditures; economic conditions; availability of sufficient financing; the ultimate ability to mine, process, and sell mineral products on economically favorable terms; and any and all other timing, exploration, development, operational, financial, budgetary, economic, legal, social, geopolitical, regulatory and political factors that may influence future events or conditions. While we consider these factors and assumptions to be reasonable based on information currently available to us, they may prove to be incorrect.
The above list is not exhaustive of the factors that may affect any of the Company’s forward-looking information. You should not place undue reliance on forward-looking information and statements. Forward-looking information and statements are only predictions based on our current expectations and our projections about future events. Actual results may vary from such forward-looking information for a variety of reasons including, but not limited to, risks and uncertainties disclosed in our filings on our website at www.ssrmining.com, on SEDAR at www.sedarplus.ca, and on EDGAR at www.sec.gov and other unforeseen events or circumstances. Other than as required by law, we do not intend, and undertake no obligation to update any forward-looking information to reflect, among other things, new information or future events. The information contained on, or that may be accessed through, our website is not incorporated by reference into, and is not a part of, this document.
Qualified Persons
The scientific and technical information concerning our mineral projects in this news release have been reviewed and verified by SLR International Corporation, RSC Consulting Ltd., WSP USA Inc., Ausenco Services Pty Ltd, and SRK Consulting Inc. are the “qualified persons” under subpart 1 of Regulation S-K 1300 (“S-K 1300”). For a description of the key assumptions, parameters and methods used to estimate mineral reserves and mineral resources included in this news release, as well as data verification procedures and a general discussion of the extent to which the estimates may be affected by any known environmental, permitting, legal, title, taxation, sociopolitical, marketing or other relevant factors, please review the Technical Report Summaries for the properties discussed in this news release, which are available under the Company’s corporate profile on EDGAR at www.sec.gov.
Supplemental Mineral Reserve and Mineral Resource Information
Hod Maden’s Mineral Reserves and Mineral Resources have been classified in accordance with the definitions for Mineral Resources in S-K 1300. Mineral Reserves and Resources are presented on a project basis (100% attributable) and have an effective date of August 31, 2025. Mineral Resources are shown exclusive of Mineral Reserves. Please refer to the section “Hod Maden Technical Report Summary,” above, for a description of SSR Mining’s ownership. This information should be reviewed in conjunction with the Hod Maden TRS.
|
|
|
|
|
|
Grade |
|
Metal |
|
Metallurgical |
|||
|
|
Attributable |
|
Tonnes |
|
Au |
Cu |
|
Au |
Cu |
|
Recovery |
|
Reserve Classification |
|
(%) |
|
(kt) |
|
(g/t) |
(%) |
|
(koz) |
(Mlb) |
|
Au |
Cu |
Proven |
|
100% |
|
1,372 |
|
22.2 |
1.7 |
|
979 |
52.8 |
|
82%–90% |
95%–98% |
Probable |
|
100% |
|
6,342 |
|
4.5 |
1.2 |
|
917 |
170.3 |
|
82%–90% |
95%–98% |
Total P+P Reserves |
|
100% |
|
7,714 |
|
7.6 |
1.3 |
|
1,896 |
223.1 |
|
82%–90% |
95%–98% |
(1) |
Mineral Reserve estimates are classified in accordance with S-K 1300. |
||||||
(2) |
Only Measured and Indicated Mineral Resources were used to define Mineral Reserves. All Inferred Mineral Resource was considered as waste. |
||||||
(3) |
The Mineral Reserve is estimated using metal prices of US$1,700/oz gold and US$3.50/lb copper. |
||||||
(4) |
Mineral Reserves are reported on a project basis (100% attributable) with the point of reference of mined ore delivered to the plant as mill feed. |
||||||
(5) |
The estimation was carried out using breakeven NSR cut-off values: |
||||||
| a. Drift and Fill: US$160/t | |||||||
| b. Long Hole Stoping: US$108/t | |||||||
| c. Incremental Stoping: US$82/t | |||||||
| d. Marginal COG: US$57/t | |||||||
(6) |
The average mining recovery and dilution factors applied were 94% and 10%, respectively. |
||||||
(7) |
Process recovery averages approximately 87% for gold and 97% for copper. |
||||||
(8) |
Totals may not add due to rounding. |
||||||
|
|
|
|
|
|
Grade |
|
Metal |
|
Metallurgical |
|||
|
|
Attributable |
|
Tonnes |
|
Au |
Cu |
|
Au |
Cu |
|
Recovery |
|
Resource Classification |
|
(%) |
|
(kt) |
|
(g/t) |
(%) |
|
(koz) |
(Mlb) |
|
Au |
Cu |
Measured |
|
100% |
|
621 |
|
23.4 |
2.3 |
|
468 |
31.6 |
|
82%–90% |
95%–98% |
Indicated |
|
100% |
|
1,100 |
|
5.4 |
1.4 |
|
191 |
33.8 |
|
82%–90% |
95%–98% |
Measured + Indicated |
|
100% |
|
1,722 |
|
11.9 |
1.7 |
|
658 |
65.3 |
|
82%–90% |
95%–98% |
Inferred |
|
100% |
|
2,574 |
|
3.4 |
0.5 |
|
281 |
26.3 |
|
82%–90% |
95%–98% |
(1) |
Mineral Resources are based on a $2,000/oz gold price and a $4.00/lb copper price and are exclusive of Mineral Reserves. |
||||||
(2) |
Mineral Resources are reported within optimized stope shapes. |
||||||
(3) |
Mineral Resources shown are reported on a project basis (100% attributable) |
||||||
(4) |
Mineral Resource cut-offs are based on a NSR value of $99/tonne. |
||||||
(5) |
Metallurgical recoveries vary between 82%–90% for Au and 95%–98% for Cu based on grade and sulfur. |
||||||
(6) |
Minimum mining width of 2 meters with no external dilution has been considered while optimizing stope shapes. |
||||||
(7) |
The point of reference for Mineral Resources is the point of feed into the processing facility. |
||||||
(8) |
Totals may vary due to rounding. |
||||||
Cautionary Note Regarding Non-GAAP Measures
We have included certain projected non-GAAP performance measures throughout this document. These performance measures are employed by us to measure our operating and economic performance internally and to assist in decision-making, as well as to provide key performance information to senior management. We believe that, in addition to conventional measures prepared in accordance with GAAP, certain investors and other stakeholders also use this information to evaluate our operating and financial performance; however, these non-GAAP measures do not have any standardized meaning. Accordingly, these projected performance measures are intended to provide additional information and should not be considered in isolation or as a substitute for measures of performance prepared in accordance with GAAP. Our definitions of our non-GAAP financial measures may not be comparable to similarly titled measures reported by other companies. These non-GAAP measures should be read in conjunction with our condensed consolidated interim financial statements.
Projected Cash costs, AISC per ounce sold, and Free Cash Flow are Non-GAAP Measures with no standardized definition under U.S. GAAP.
Non-GAAP Measure – Projected Cash Costs and AISC
Projected Cash Costs and All-In Sustaining Costs (“AISC”) per payable ounce of gold and respective unit cost measures are non-U.S. GAAP metrics developed by the World Gold Council to provide transparency into the costs associated with producing gold and provide a standard for comparison across the industry. The World Gold Council is a market development organization for the gold industry.
The Company uses cash costs per ounce of precious metals sold and AISC per ounce of precious metals to monitor its operating performance internally. The most directly comparable measure prepared in accordance with GAAP is cost of sales. The Company believes this measure provides investors and analysts with useful information about its underlying cash costs of operations and the impact of byproduct credits on its cost structure. The Company also believes it is a relevant metric used to understand its operating profitability. When deriving the cost of sales associated with an ounce of precious metal, the Company includes by-product credits, which allows management and other stakeholders to assess the net costs of gold and silver production. In deriving costs on a by-product basis, the Company considers copper to be a by-product and costs per payable ounce are calculated based on gold ounces sold. In deriving costs on a co-product basis, the Company anticipates no by-product credits and costs per payable ounce are calculated based on gold equivalent ounces sold. The Company believes that presenting costs on both a by-product and co-product basis to be useful to investors in order to understand this assets operating profitability.
AISC includes total cost of sales incurred at the Company's mining operations, which forms the basis of cash costs. Additionally, the Company includes sustaining capital expenditures, sustaining mine-site exploration and evaluation costs, reclamation cost accretion and amortization, and general and administrative expenses. This measure seeks to reflect the ongoing cost of gold and silver production from current operations; therefore, growth capital is excluded. The Company determines sustaining capital to be capital expenditures that are necessary to maintain current production and execute the current mine plan. The Company determines growth capital to be those payments used to develop new operations or related to projects at existing operations where those projects will materially benefit the operation.
The Company believes that AISC provides additional information to management and stakeholders that provides visibility to better define the total costs associated with production and better understanding of the economics of the Company's operations and performance compared to other producers. In deriving the number of ounces of precious metal sold, the Company considers the physical ounces available for sale after the treatment and refining process, commonly referred to as payable metal, as this is what is sold to third parties.
The following tables provide a reconciliation of projected Cost of sales to Cash costs and AISC used in the 2025 Hod Maden TRS on a project basis (100% attributable) over the life of the mine (2025 – 2038):
(in millions, unless otherwise noted) |
|
Co-Product Basis |
|
By-Product Basis |
|||
Cost of sales (GAAP) (1) |
|
$ |
1,802 |
|
$ |
1,802 |
|
By-product credit |
|
$ |
— |
|
$ |
(942 |
) |
Cash costs (non-GAAP) |
|
$ |
1,802 |
|
$ |
860 |
|
Sustaining capital |
|
$ |
75 |
|
$ |
75 |
|
Closure and reclamation capital |
|
$ |
14 |
|
$ |
14 |
|
Total AISC (non-GAAP) |
|
$ |
1,891 |
|
$ |
949 |
|
|
|
|
|
|
|||
Gold sold (koz) |
|
|
1,609 |
|
|
1,609 |
|
Copper sold (Mlb) |
|
|
209 |
|
|
— |
|
Gold equivalent sold (koz) (2) |
|
|
1,909 |
|
|
1,609 |
|
|
|
|
|
|
|||
Cost of sales ($/oz GEO sold) (2) |
|
$ |
944 |
|
$ |
1,120 |
|
Cash costs ($/oz GEO sold) (2) |
|
$ |
944 |
|
$ |
535 |
|
AISC ($/oz GEO sold) (2) |
|
$ |
991 |
|
$ |
590 |
|
(1) |
Excludes depreciation, depletion, and amortization. |
||||||
(2) |
GEOs are calculated using the copper sold multiplied by the ratio of the copper price to the gold price at the average commodity prices for the period stated in the TRS. GEOs sold may not re-calculate based on amounts presented in this table due to rounding. |
||||||
Non-GAAP Measure – Projected Free Cash Flow
The Company uses Free Cash Flow to provide transparency about expected cash flows from the Hod Maden Project. The most directly comparable financial measures prepared in accordance with GAAP is cash provided by operating activities. The Company believes that in addition to conventional measures prepared in accordance with US GAAP, certain investors and analysts use this information to evaluate the ability of the Company to generate cash flow after capital investments and build the Company's cash resources. The Company calculates Free Cash Flow by deducting cash capital spending from cash generated by operating activities. The Company does not deduct payments made for business acquisitions.
The following table provides a reconciliation of projected operating cash flow (or cash provided by operating activities) to Free Cash Flow on a project basis (100% attributable) over the life of the Hod Maden mine (2025 – 2038):
(in millions, unless otherwise noted) |
|
Life of Mine (2025 – 2038) |
||
Earnings Before Taxes (GAAP) |
|
$ |
3,207 |
|
Corporate Income Tax Payable |
|
$ |
(784 |
) |
Net Income (GAAP) |
|
$ |
2,423 |
|
Non-Cash Add Back – Depreciation |
|
$ |
1,029 |
|
Working Capital |
|
$ |
— |
|
Operating Cash Flow (GAAP) |
|
$ |
3,452 |
|
|
|
|
||
Initial capital Costs |
|
$ |
910 |
|
Sustaining Capital |
|
$ |
75 |
|
Final Closure / Reclamation Costs |
|
$ |
14 |
|
Total Capital (GAAP) |
|
$ |
999 |
|
|
|
|
||
Free Cash Flow (non-GAAP) |
|
$ |
2,453 |
|
Realized Cash Calculation
Acquisition Value for the SSR Mining / Alacer Merger and non-core asset sales are based on the analyst NAV at announcement; Acquisition Value for all other transactions include initially announced acquisition price, subsequent property acquisitions, earn-in milestone payments and the present value of contingent payments.
Current values are rounded and Analyst NAV are based on broker consensus research as of January 9, 2026. “Realized Cash” means revenue less cost of sales, exploration, evaluation, and reclamation expenditures, cash care and maintenance, capital expenditures and taxes; please see endnotes for additional details. Realized cash for CC&V of $85 million in the first half of 2025 aligns with the TRS effective date of July 1, 2025. Actual reported mine site after-tax Free Cash Flow was approximately $115 million from the acquisition’s close to the end of Q3 2025.
The following table provides a calculation of realized cash for Marigold since acquisition on April 4, 2014 through September 30, 2025 Seabee since acquisition on May 31, 2016 through September 30 ,2025 and for CC&V since acquisition on February 28, 2025 through June 30, 2025:
(in thousands of US dollars) (3) |
|
Marigold |
|
Seabee |
|
CC&V |
|||||||
Revenue (GAAP) |
|
$ |
3,970 |
|
|
$ |
1,525 |
|
|
$ |
185 |
|
|
Cost of Sales |
|
$ |
(2,190 |
) |
|
$ |
(590 |
) |
|
$ |
(68 |
) |
|
Exploration and Evaluation Expenditures |
|
$ |
(110 |
) |
|
$ |
(105 |
) |
|
$ |
(5 |
) |
|
Care & Maintenance (Cash) |
|
$ |
— |
|
|
$ |
(25 |
) |
|
$ |
— |
|
|
Capital Expenditures |
|
$ |
(650 |
) |
|
$ |
(285 |
) |
|
$ |
(16 |
) |
|
Realized Cash Before Taxes (non-GAAP) |
|
$ |
1,020 |
|
|
$ |
525 |
|
|
$ |
96 |
|
|
Taxes (4) |
|
$ |
(135 |
) |
|
$ |
(130 |
) |
|
$ |
(12 |
) |
|
Realized Cash After Taxes (non-GAAP) |
|
$ |
885 |
|
|
$ |
395 |
|
|
$ |
84 |
|
|
(3) |
Figures may not add due to rounding |
||||||
(4) |
Represents federal and state taxes paid since acquisition |
||||||
Realized proceeds from non-core asset sales include $100 million for the sale of SSR Mining’s non-core royalty portfolio on July 29, 2021, $127 million for the sale of the Pitarrilla project on January 13, 2022, $1.5 million for the sale of Sunrise Lake exploration property on October 17, 2023, $57.5 million for the sale of the San Luis project on November 27, 2023, and approximately $19 million in proceeds from the sale of non-core equity positions from April 1, 2021 to December 31, 2025.
View source version on businesswire.com: https://www.businesswire.com/news/home/20260128521929/en/
Contacts
For more information, please visit: www.ssrmining.com.
E-Mail: invest@ssrmining.com
Phone: +1 (888) 338-0046


